
NEWS

16 Jan 2024 - Investing in toll roads
|
Investing in toll roads Magellan Asset Management November 2023 |
|
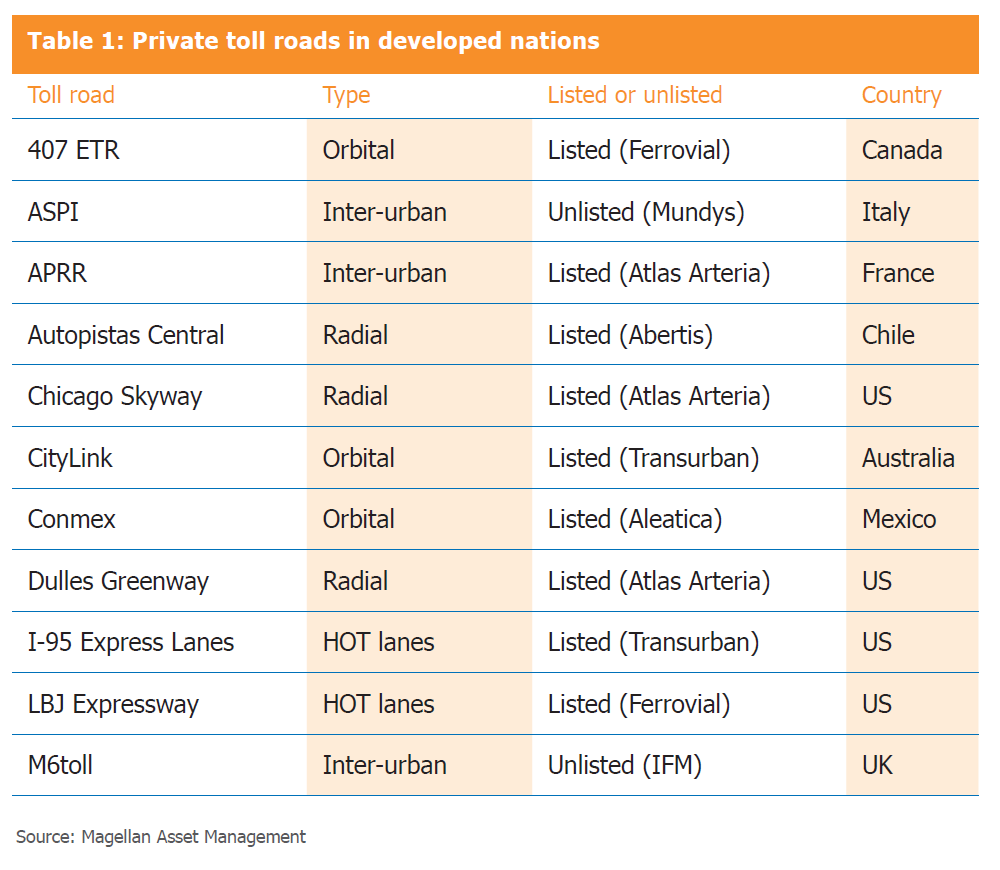
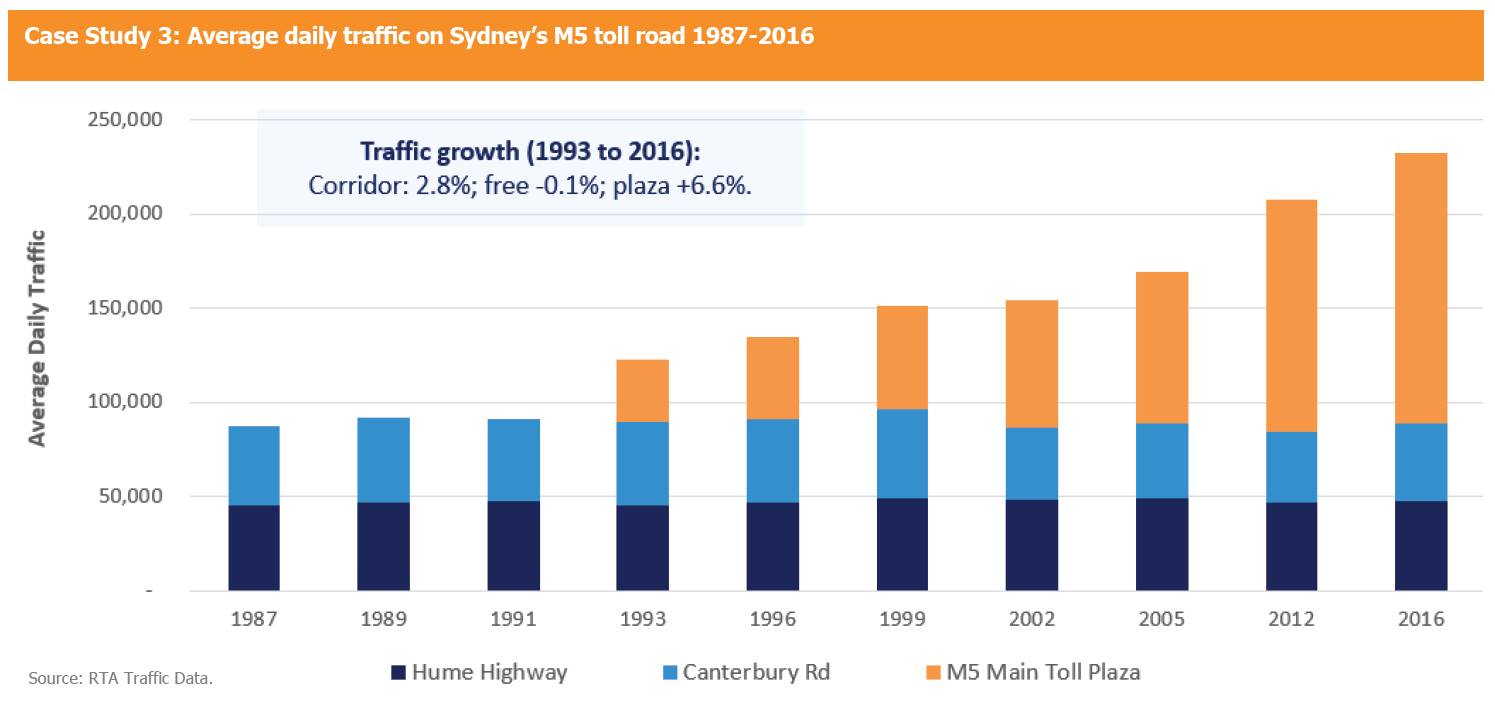
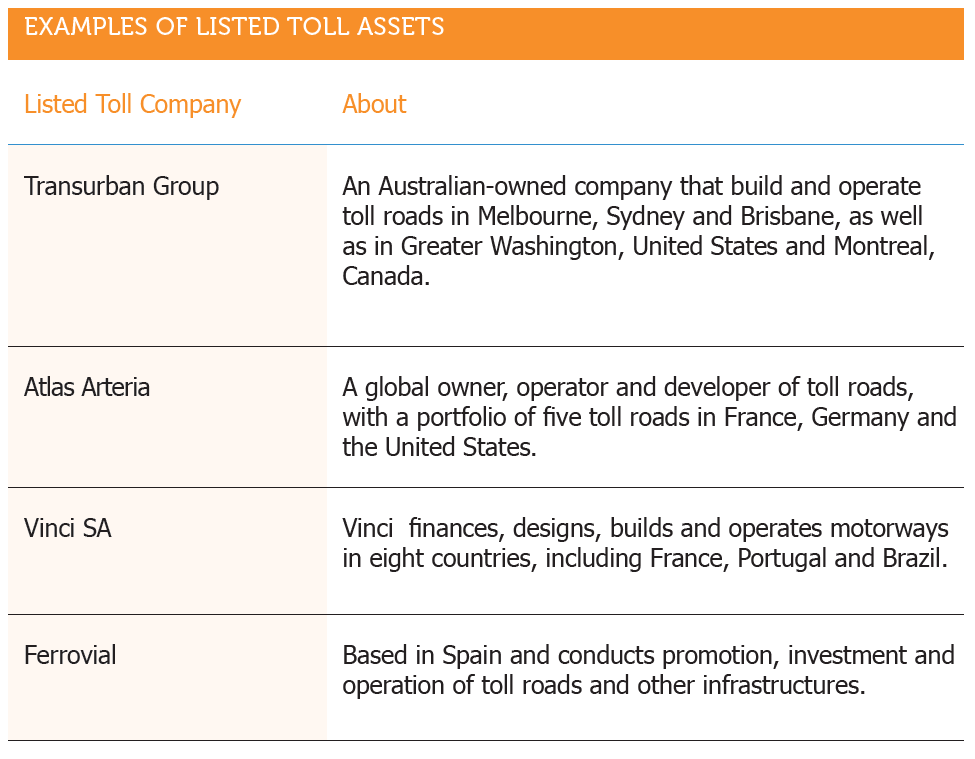
While we tend to think of toll roads as a recent phenomenon, they have been around for thousands of years. Toll roads today are a popular way for cash-strapped governments to raise money and improve the quality of, and reduce the congestion on road networks. Given the huge capital costs (toll roads often cost billions of dollars to build), for most investors the listed market is the only way to gain access to these assets. Types of toll roadsThere are two main types of toll roads; inter-urban toll roads (those between cities); and intra-urban toll roads (those within cities), which can be further be divided into radial, orbital and high-occupancy toll (HOT) lanes. Each road varies in terms of its dynamics but, in general, this difference stems from the types of users and the trips undertaken. Intra-urban toll roads typically host a higher proportion of cars - with a significant part of this related to people traveling to and from work and going about their daily lives. Consequently, in an economic downturn, while some traffic will divert to the alternative free route, as long as people have jobs to go to or errands to run, the diversion is likely to be minimal. By contrast, roads between cities tend to have higher proportions of commercial traffic and discretionary trips, which are more economically sensitive.
|
|
Funds operated by this manager: Magellan Global Fund (Hedged), Magellan Global Fund (Open Class Units) ASX:MGOC, Magellan High Conviction Fund, Magellan Infrastructure Fund, Magellan Infrastructure Fund (Unhedged), MFG Core Infrastructure Fund Important Information: This material has been delivered to you by Magellan Asset Management Limited ABN 31 120 593 946 AFS Licence No. 304 301 ('Magellan') and has been prepared for general information purposes only and must not be construed as investment advice or as an investment recommendation. This material does not take into account your investment objectives, financial situation or particular needs. This material does not constitute an offer or inducement to engage in an investment activity nor does it form part of any offer documentation, offer or invitation to purchase, sell or subscribe for interests in any type of investment product or service. You should obtain and consider the relevant Product Disclosure Statement ('PDS') and Target Market Determination ('TMD') and consider obtaining professional investment advice tailored to your specific circumstances before making a decision about whether to acquire, or continue to hold, the relevant financial product. A copy of the relevant PDS and TMD relating to a Magellan financial product may be obtained by calling +61 2 9235 4888 or by visiting www.magellangroup.com.au. Past performance is not necessarily indicative of future results and no person guarantees the future performance of any financial product or service, the amount or timing of any return from it, that asset allocations will be met, that it will be able to implement its investment strategy or that its investment objectives will be achieved. This material may contain 'forward-looking statements'. Actual events or results or the actual performance of a Magellan financial product or service may differ materially from those reflected or contemplated in such forward-looking statements. This material may include data, research and other information from third party sources. Magellan makes no guarantee that such information is accurate, complete or timely and does not provide any warranties regarding results obtained from its use. This information is subject to change at any time and no person has any responsibility to update any of the information provided in this material. Statements contained in this material that are not historical facts are based on current expectations, estimates, projections, opinions and beliefs of Magellan. Such statements involve known and unknown risks, uncertainties and other factors, and undue reliance should not be placed thereon. No representation or warranty is made with respect to the accuracy or completeness of any of the information contained in this material. Magellan will not be responsible or liable for any losses arising from your use or reliance upon any part of the information contained in this material. Any third party trademarks contained herein are the property of their respective owners and Magellan claims no ownership in, nor any affiliation with, such trademarks. Any third party trademarks that appear in this material are used for information purposes and only to identify the company names or brands of their respective owners. No affiliation, sponsorship or endorsement should be inferred from the use of these trademarks. This material and the information contained within it may not be reproduced, or disclosed, in whole or in part, without the prior written consent of Magellan. |

15 Jan 2024 - New Funds on Fundmonitors.com
|
New Funds on FundMonitors.com |
|
Below are some of the funds we've recently added to our database. Follow the links to view each fund's profile, where you'll have access to their offer documents, monthly reports, historical returns, performance analytics, rankings, research, platform availability, and news & insights. |
 |
|||||||||||||||||||||
| T. Rowe Price Global Equity (Hedged) Fund - I Class | |||||||||||||||||||||
|
|||||||||||||||||||||
| View Profile | |||||||||||||||||||||
| T. Rowe Price Dynamic Global Bond Fund S Class | |||||||||||||||||||||
|
|||||||||||||||||||||
| View Profile | |||||||||||||||||||||
| T. Rowe Price Dynamic Global Bond Fund I Class | |||||||||||||||||||||
|
|||||||||||||||||||||
| View Profile | |||||||||||||||||||||
 |
|||||||||||||||||||||
| Perpetual Balanced Growth Fund | |||||||||||||||||||||
|
|||||||||||||||||||||
| Perpetual ESG Real Return Fund | |||||||||||||||||||||
|
|||||||||||||||||||||
| Perpetual Diversified Real Return Fund - Class Z | |||||||||||||||||||||
|
|||||||||||||||||||||
| View Profile | |||||||||||||||||||||
|
Want to see more funds? |
|||||||||||||||||||||
|
Subscribe for full access to these funds and over 790 others |

21 Dec 2023 - Hedge Clippings | 21 December 2023
|
|
|
|
Hedge Clippings | 21 December 2023
News & Insights New Funds on FundMonitors.com Market Commentary | Glenmore Asset Management The 'low emissions' megatrend: Is it too early to invest in green hydrogen? | Insync Fund Managers Investment Perspectives: 12 surprising charts for your Christmas stocking | Quay Global Investors November 2023 Performance News Bennelong Twenty20 Australian Equities Fund Insync Global Capital Aware Fund Equitable Investors Dragonfly Fund Digital Asset Fund (Digital Opportunities Class) |
|
|
If you'd like to receive Hedge Clippings direct to your inbox each Friday |


21 Dec 2023 - Performance Report: Equitable Investors Dragonfly Fund
[Current Manager Report if available]

21 Dec 2023 - Performance Report: Insync Global Quality Equity Fund
[Current Manager Report if available]
21 Dec 2023 - Performance Report: Insync Global Capital Aware Fund
[Current Manager Report if available]

21 Dec 2023 - Performance Report: Digital Asset Fund (Digital Opportunities Class)
[Current Manager Report if available]

21 Dec 2023 - Performance Report: PURE Resources Fund
[Current Manager Report if available]

21 Dec 2023 - What is the Fed's Senior Loan Officer Survey and what is it telling us?
|
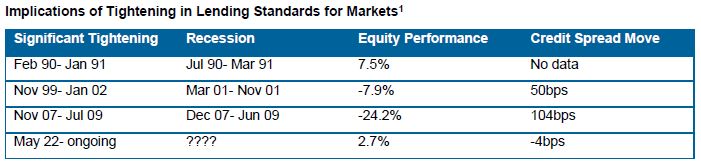
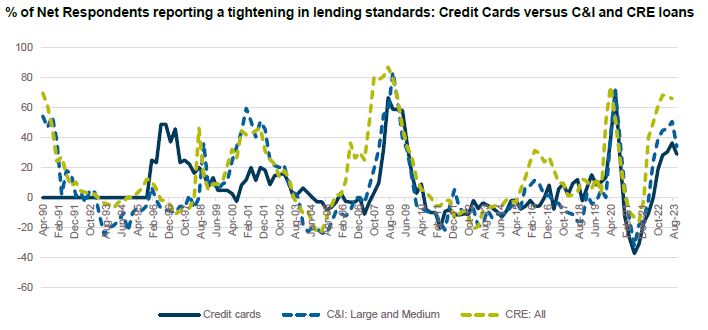
What is the Fed's Senior Loan Officer Survey and what is it telling us? Challenger Investment Management November 2023 The financial system of the United States is unique. Unlike Australia where households and institutions are at the mercy of the four major banks, the US banking system is highly dispersed. There are over 4,000 commercial banks and over 500 savings and loan associations. The top 4 banks represent less 50% of total assets in the banking system; in Australia this figure is over 70%. With so many individual lenders, the Federal Reserve Board (the Fed) conducts a quarterly survey to gauge the degree to which financial conditions are changing. This is called the SLOOS, the Senior Loan Officer Opinion Survey on Bank Lending Practices. The survey polls up to 80 large domestic banks and 24 branches of individual banks. The questions address the degree to which banks are tightening lending standards, how the demand for credit is evolving as well as how the pricing of credit risk is changing. The results of the survey are reported to the Federal Open Market Committee (FOMC) and feed into monetary policy decision making. The survey has been repeatedly shown to have high predictive content with a tightening in lending standards being strongly correlated with a slowing in GDP growth. In this month's "What We're Watching" we take a closer look at the Senior Loan Officer Survey in an attempt to identify the degree to which standards are tightening and where the tightening is most acute. Observation 1: Previously when banks tightened by as much as they have done to date, a recession has followed A challenge in interpreting the survey data is that the questions asked of the banks have binary responses with the measure tracking the net percentage of respondents answering in the affirmative. It gives no indication as to the degree to which standards were tightened or pricing increased. There are also small biases in responses; for example, a bias towards tightening of credit standards with an average 6% of net respondents indicating tightening for C&I loans since 1990. Since 1990 there have been 4 periods of significant tightening in credit standards (which we define as 4 consecutive quarters where 20% or more of net respondents reporting tightening in standards for C&I loans). All 3 previous periods of significant tightening in credit standards were followed by a recession and in two of the 3 a selloff in credit and equity markets.
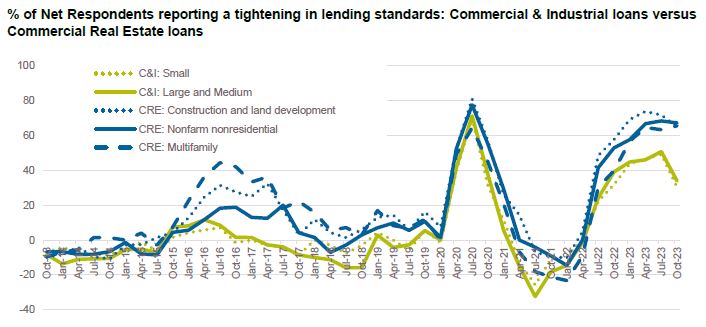
There have also been several periods where banks have meaningfully loosened credit standards. The mid 1990s (mid 93 to mid 95) and mid 2000s (early 04 to mid 06) saw extended periods of loosening lending standards. More recently banks loosened lending standards from early 2021 to mid 2022 including the most negative net percentage of respondents reporting tightening on record; -32.4% for the quarter ended Jul-21 (although it is arguable that some of this loosening was a reversal of the sharp tightening we saw when COVID hit). Our take is that the tightening in lending standards is not over. While standards were not excessively loose in 2022, we think the tightening will eventually weigh on risk markets. Observation 2: pricing on C&I loans is increasing The SLOOS also asks banks whether they are increasing spreads of loans over the Banks' cost of funds. Historically banks have had a slight bias towards tightening pricing albeit with responses being far more volatile than responses around lending standards. Interestingly the correlation between tightening in lending standards and changing spreads is only around 60%. Banks tend to reach a point where they are unwilling to loosen lending standards any further but are still willing to compete on price. For example, banks tightened pricing on C&I loans for longer periods than they loosened credit standards; from early 1993 to mid 1998 and from mid 2003 until mid 2007, respectively. In contrast, when standards tighten banks tend to also widen pricing concurrently. The widening in pricing has two effects - it further exacerbates credit pressure on borrowers, especially when combined with the significant increase in base interest rates. Secondly it creates opportunities for alternative lenders to disintermediate the banks. Observation 3: CRE lending standards are far tighter than C&I lending standards Commercial real estate (CRE) lending standards have tightened by far more than commercial and industrial loans. Demand for credit has also declined to levels not seen since the Global Financial Crisis (GFC). Even sectors such as Multifamily which are performing relatively well in a fundamental sense are experiencing a sharp tightening in lending standards.
To date, non-farm non-residential CRE lending has experienced 5 consecutive quarters where more than 50% of net respondents have tightened lending standards. The longest such period on record was the GFC with 7 quarters. No other period since 1990 has seen more than 2 consecutive quarters of >50% net respondents tightening credit standards. Observation 4: The consumer is still okay The survey data for credit cards implies a far less severe tightening in credit standards. The leadup is similar with the 2020 tightening and 2021 loosening in credit standards tracking closer to C&I and CRE loans but paths diverge in late 2022. New and used auto loans have experienced even less of a tightening in standards than credit cards.
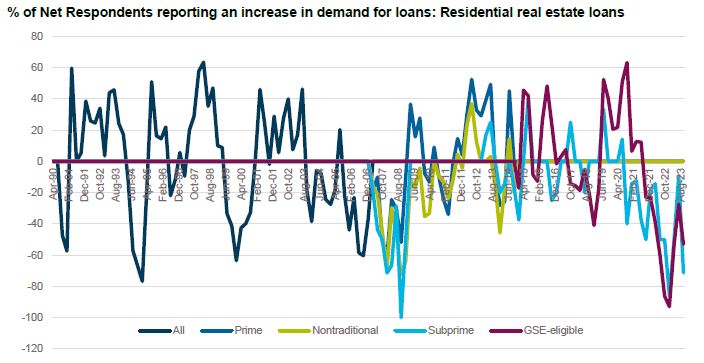
Residential mortgages, the epicentre of the GFC, have also not experienced a material amount of tightening in credit standards. Demand for consumer credit, both secured and unsecured has also not picked up materially with a reduction in demand being reported for auto loans and consumer loans ex credit cards and auto loans. However, demand for mortgages has fallen to GFC lows, in large part due to mortgage rates which are around 8%, levels not seen for more than 20 years.
Domestic survey data While APRA does not collate consolidated survey data on lending conditions, several banks conduct their own surveys. NAB completes a quarterly survey on commercial property markets where borrowers have reporting difficulties in accessing credit with availability in line with pre-COVID levels. This suggests that while credit standards for real estate lending are tightening in Australia, they are not tightening at the same pace as in the United States.
In conclusion... Despite the relatively benign indications in Australia, the SLOOS implies a far sharper tightening in credit conditions especially in commercial real estate lending markets. Pricing of risk is also heading higher. While we don't necessarily expect tighter lending conditions in the US to flow directly to Australia (in aggregate our banks are in a stronger capital and liquidity position than the US banking system), we do think the tighter conditions in the US may precipitate an increase in risk premiums across markets. After all, when the US sneezes, the rest of the world catches a cold. Funds operated by this manager: Challenger IM Credit Income Fund, Challenger IM Multi-Sector Private Lending Fund For Adviser & Investors Only [1] All the data in this report is sourced from the SLOOS which is produced by the Federal Reserve. https://www.federalreserve.gov/data/sloos.htm |

20 Dec 2023 - Performance Report: Altor AltFi Income Fund
[Current Manager Report if available]