
NEWS

16 Sep 2021 - The Looming Housing Excess
|
The Looming Housing Excess Yarra Capital Management August 2021 |
|
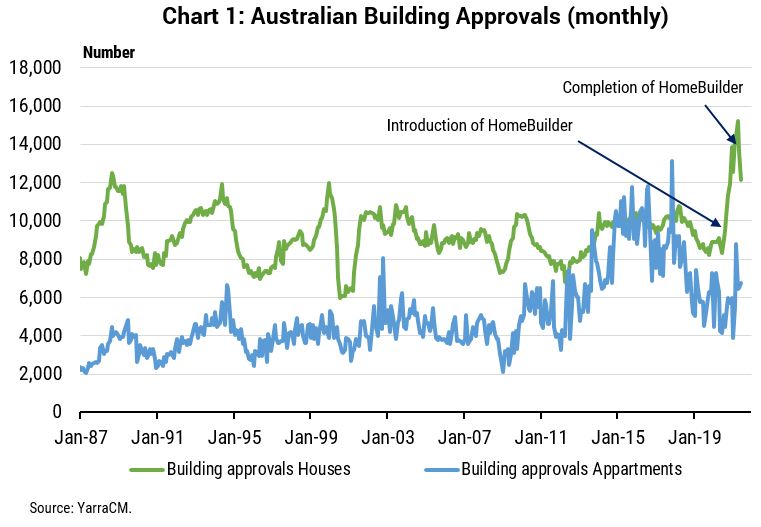
Analysis of Australia's housing sector from Tim Toohey, Head of Macro and Strategy, suggests excess supply is coming on the back of historic government stimulus measures and an absence of net migration. In an apparent suspension of collective logic, it appears few people have asked what happens when you provide massive incentives to bring forward an unprecedented spike in house construction while simultaneously choking off future demand by halting net migration. Away from the fog of COVID, any reasonable minded person would have concluded that unless the starting position was a massive undersupply of housing, then this combination of policy settings would soon generate a large excess of housing. In this note we summarise how large this excess in housing is likely to be and the investment conclusions. What happens when a Government program is too successful in inducing supply?The HomeBuilder program, in concert with generous incentives from State governments and mortgage rate reductions, has proven successful in bringing forward construction. But have they been too successful? Recall that upon the introduction of the HomeBuilder scheme, the Treasury estimated that COVID-19 would see cancellations of housing projects of ~30%, compared with ~17% during the Global Financial Crisis. This reduced the Treasury's pre-COVID housing starts estimate of 171k to just 111k. The HomeBuilder scheme was explicitly designed to offset half of the expected decline in starts, with the aim of backfilling 30k starts in 2020-21. That is, the Treasury was hoping to achieve ~140k housing starts once HomeBuilder was fully implemented. Instead, approvals for houses have exploded to the upside. By the March quarter of 2021 dwelling approvals were annualising at 278k (refer Chart 1), and even though approvals have declined from that peak, by the end of the 2020-21 financial year some 200.4k dwelling were approved. Single home approvals were even more spectacular, with a record 136.6k approved during the year, to be 31% above the prior financial year. Of course, this also excludes the surge in approvals for renovations over the same period.
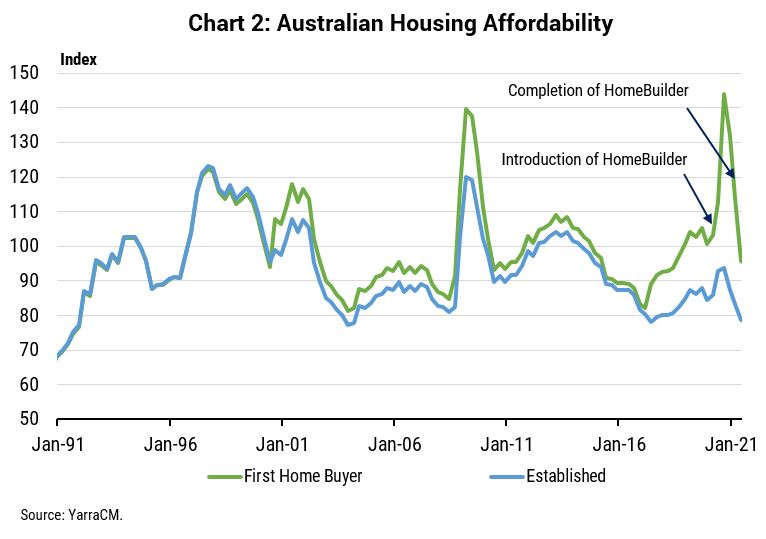
In the end, 99.3k HomeBuilder applications were received by the Government to build a new home and a further 22.1k applications were received for a 'substantial renovation'. Which means the HomeBuilder program exceeded Treasury's objectives for new dwelling construction by 330%. The clear lesson being never stand between an Australian household and an uncapped government program! Taxpayers have effectively handed out almost $3bn in 'free money' to people to build or renovate their home. Such Federal government largess was obviously well received. However, what is less well understood is that State Governments were also busily providing their own incentives, especially via stamp duty exemptions for first home buyers. These incentives varied by state and in many instances were in place prior to JobKeeper. To put the incentives in context, we have created separate housing affordability indices for established and first home buyers. This captures all the incentives and taxes by State and Federally in addition to all the standard factors that influence affordability - house prices, mortgage rates, loan to deposit ratio and household income.
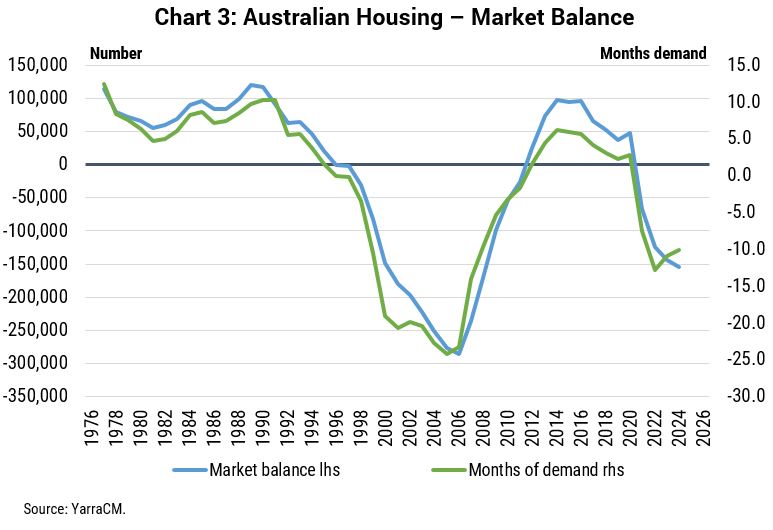
Chart 2 shows the enormous boost to housing affordability for first home buyers that was provided principally by shifting government incentives. The subsequent decline in affordability is mostly due to the lapsing of the HomeBuilder incentive, although 15%yoy growth in house prices by mid-2021 has also weighed heavily on affordability. These seismic shifts in housing affordability ultimately determines the near term path of housing approvals. But it is important to recognise that the incentives and inducements do not create new demand for housing. Rather they merely bring forward housing construction that would otherwise have been demanded at a later stage. The bigger the pull forward, the bigger the decline once affordability declines back to its pre-incentive levels. What happens when a pandemic eradicates future demand?But what if you not only provide massive incentives to pull forward the supply of new houses, but also simultaneously eradicate one-third of future demand for housing? Housing can only be demanded by those who have placed themselves in a situation to form a household. We spend a lot of time modelling the demographic structure of the population in Australia and how that relates to future housing demand. It's a relatively complex process that incorporates factors as diverse as; the relationship type and number of dependants of each household, the type of structural dwelling, the vacancy rate of established dwellings, demolitions, and trends towards second or lifestyle homes. The census data is an important input for the historical analysis, however, the forward projections rely heavily upon the accuracy of the ABS's population projections. Although the ABS provides three main scenarios for future population growth, their projections have been rendered useless by the de facto ban on net migration from travel restrictions. As such, we have recast the population projections by looking at the age characteristics of migrants and assumed that net migration doesn't return to pre-COVID type levels until 2023. By modelling the future supply of new housing as a function of the change in affordability and comparing that demographic demand for housing adjusted for the unprecedented reduction in net migration, we can solve for the likely future oversupply of Australian houses. We define 'market balance' for housing as the most recent year that demographic demand and completions were equal in number. As such the accumulation of the difference between demographic demand for housing and completions of housing from the year of market balance determines the excess or undersupply of housing through time. We estimate that by the end of 2023 Australia will have 150k dwellings in excess of demographic demand (refer Chart 3). This would be the largest excess of housing since 2008, and this rather sombre forecast embeds as a base case of a 30% decline in dwelling approvals by the end of 2022.
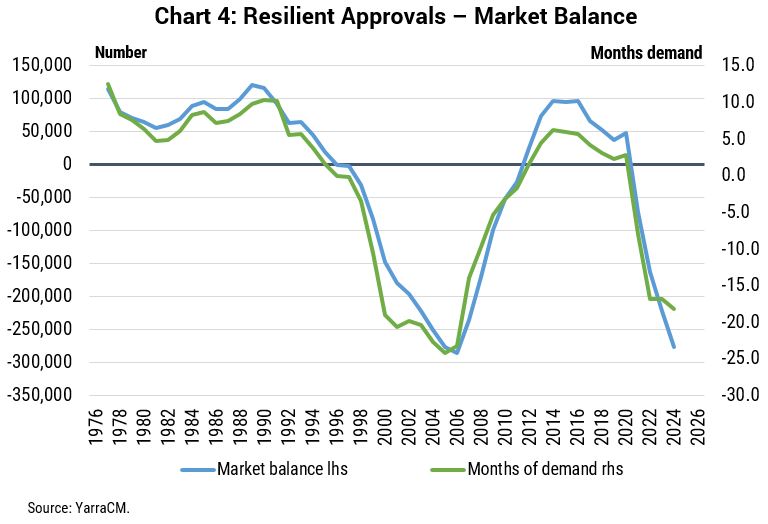
What happens to the excess of established homes if the immigration recovery is delayed or if building approvals remain elevated?What if housing approvals don't fall as sharply as our base case? Demand for housing is ultimately determined by demographic demand, but participants in the housing market typically operate with a more limited information set. And what happens if Australians become so enamoured with recent house price gains that Australia continues to build at an excess rate? If we assume only a 10% decline in approvals is recorded by the end of 2022, then the excess of housing will equal the peak excess of 2006 (refer Chart 4) which on our calculations was greatest excess of housing since our calculations commenced in 1976.
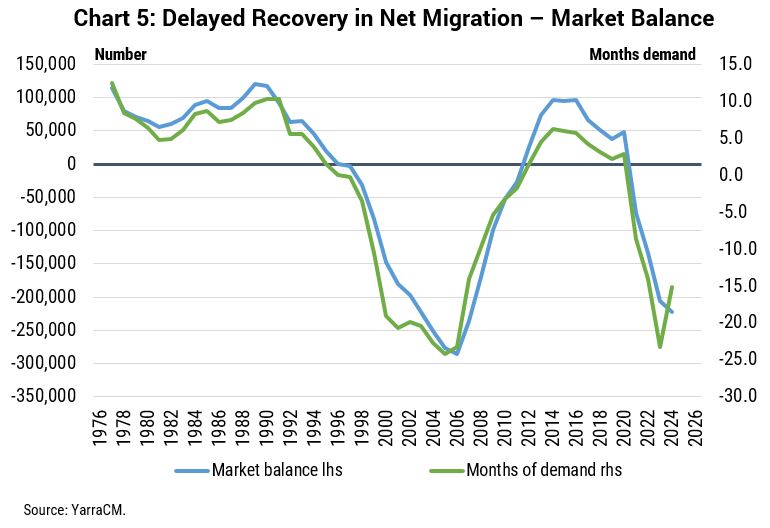
Alternatively, what happens if net migration doesn't bounce back to 200k by 2023? How would that affect the base case? If we assume net migration of +20,000 in 2021 and +75,000 in 2022 (instead of +200,000 under our base case) the oversupply of housing will increase from 150k to some 200k by the end of 2023 (refer Chart 5).
What are the investment conclusions?Just under 70% of all households either own their own home outright or are in the process of paying off a mortgage. Housing remains the largest financial asset that most households own and we estimate that by mid-2021 the value of the housing stock is $8.9 trillion - 3.7 times the market capitalisation of the ASX200 and 4.5 times the size of the Australian economy. Clearly, such large and valuable asset should be managed with care. Moving into a large oversupply of housing does not necessarily mean that house prices are at risk of significant decline. The prime example is that the peak excess of housing in 2006 did not unleash a sharp fall in prices. Price growth did slow significantly during the 2003-06 period, but two important things happened that avoided the housing excess translate into falling prices. Firstly, the combination of stronger household formation rates of the local population and a mining-related boom in immigration transformed the demographic demand for housing. In the 10 years to 1996, we estimate the demand for housing averaged 140k per year. In the 10 years to 2006, housing demand had slipped to just 118k per year. However, in the period since 2007 Australia's annual housing demand has averaged 199k, with a large step change occurring in 2006 due to more Australians moving into key household formation age brackets and the surge in net migration associated with the mining boom. This step change was crucial in gradually absorbing the excess of housing that had previously accumulated. Secondly, the Global Financial Crisis and the subsequent slow economic recovery saw the RBA cash rate decline from 7.25% in August 2008 to 0.75% pre-COVID and just 0.10% post-COVID. Capitalising low interest rates into house prices has become something of a national sport ever since. The problem facing Australia today is two-fold: (i) interest rates are today at the lower bound, and (ii) housing demand is now hostage to the evolution of the pandemic and how fast we choose to ramp up immigration in the post-vaccination phase. Quite simply, the RBA cannot cut any further and politicians may be reluctant to open up immigration from low-vaccinated countries. In our view, repeating the good fortune of the post-2006 period seems highly unlikely. Contrary to the current fervour of house buying, the risk of lower house prices over the next two years is at least as high as further house price increases. As in most financial markets confidence is always highest at the peak in prices. We are not using this analysis of excess housing to suggest a sharp decline in house prices is imminent. Indeed, low real mortgage rates may sustain prices at elevated levels. Rather, we are suggesting that expectations of ongoing house price gains over the next two years may be disappointed and more importantly the boom in new single house construction will be followed by a deep downturn. The first investment conclusion is that Banks should be thinking in terms of building provisions against the risk of weaker prices, rather than continuing to release provisions as seen over the past 12 months. The failure to do so may risk P/E multiples de-rating once the oversupply of housing becomes clear to financial markets. Clearly, bank average LVRs and bad debts are low by historical comparison, providing ample protection against any house price declines. Nevertheless, the boom in new borrowers for single homes on the periphery of the major cities are yet to build equity in their home and are more vulnerable to any decline in house prices. The second investment conclusion is that there is really only one way to avoid a large oversupply of housing, and that is to stop building so many of them. Our base case has a significantly larger decline embedded than the consensus view and is well below that of the RBA which is currently forecasting of dwelling investment declining just 0.5% in 2022, before rising again. Ultimately, it is on this point where we disagree the most. As stated above, you can't create new housing demand, you can merely alter the timing of when that demand is realised. No more rate cuts, lapsing of incentives and damaged affordability via recent price spikes will see dwelling approvals fall sharply, particularly single home approvals. The only way Australia avoids a significant excess of housing by 2023 is if approvals fall far more than anyone expects. With full knowledge that building material company earnings will remain robust as the backlog of homes and renovations to be built remains large, it is the trajectory of housing approvals that has historically governed the share prices of these companies. It has been a great ride up for the building material companies, but we are past the peak, and the outlook today looks increasingly gloomy. The final investment conclusion is that the RBA will not be tempted to raise interest rates while the housing construction sector - the most interest rate sensitive sector in the Australian economy - transitions from boom to bust. The RBA will only be tempted to commence the rate hiking cycle once inflation has been at target for at least six months, wages are approaching 3% growth, net migration is firmly on the path to recovery and the housing approvals downcycle is complete. These criteria are highly unlikely to be achieved prior to 1H23, so regardless of what other central banks do in the interim the RBA's record low interest rate setting is set to remain for a long time yet. |
|
Funds operated by this manager: Yarra Australian Equities Fund, Yarra Emerging Leaders Fund, Yarra Enhanced Income Fund, Yarra Income Plus Fund |


15 Sep 2021 - Performance Report: Airlie Australian Share Fund
| Report Date | |
| Manager | |
| Fund Name | |
| Strategy | |
| Latest Return Date | |
| Latest Return | |
| Latest 6 Months | |
| Latest 12 Months | |
| Latest 24 Months (pa) | |
| Annualised Since Inception | |
| Inception Date | |
| FUM (millions) | |
| Fund Overview | The Fund is long-only with a bottom-up focus. It has a concentrated portfolio of 15-35 stocks (target 25). Maximum cash holding of 10% with an aim to be fully invested. Airlie employs a prudent investment approach that identifies companies based on their financial strength, attractive durable business characteristics and the quality of their management teams. Airlie invests in these companies when their view of their fair value exceeds the prevailing market price. It is jointly managed by Matt Williams and Emma Fisher. Matt has over 25 years' investment experience and formerly held the role of Head of Equities and Portfolio Manager at Perpetual Investments. Emma has over 8 years' investment experience and has previously worked as an investment analyst within the Australian equities team at Fidelity International and, prior to that, at Nomura Securities. |
| Manager Comments | The fund's returns over the past 12 months have been achieved with a volatility of 10.71% vs the index's 10.33%. The annualised volatility of the fund's returns since inception in June 2018 is 16.28% vs the index's 16.71%. Over the past 24 and 36 month periods, the fund's returns have had an annualised volatility of 18.97% and 16.86% respectively, lower than the index's annualised volatility over both periods; 19.72% (24 months), 17.34% (36 months). Since inception in June 2018 in the months where the market was positive, the fund has provided positive returns 100% of the time, contributing to an up-capture ratio for returns since inception of 112.96%. Over all other periods, the fund's up-capture ratio has ranged from a high of 123.44% over the most recent 24 months to a low of 112.28% over the latest 36 months. An up-capture ratio greater than 100% indicates that, on average, the fund has outperformed in the market's positive months. The fund's down-capture ratio for returns since inception is 95.6%. Over all other periods, the fund's down-capture ratio has ranged from a high of 95.6% over the most recent 36 months to a low of 88.36% over the latest 24 months. A down-capture ratio less than 100% indicates that, on average, the fund has outperformed in the market's negative months. |
| More Information |

15 Sep 2021 - The Long and The Short: What reporting season can tell us about life in Australia
|
The Long and The Short: What reporting season can tell us about life in Australia Kardinia Capital 2 September 2021 |
|
Just as the Australian Census promises to provide a comprehensive snapshot of the country and how we are changing, so too the recently-complete Australian profit reporting season can tell us what life has been like for Australians over the past 12 months.
Growth of online sales
Australian online home furnishing retailer Temple and Webster (TPW) is another such example, where FY21 revenue is up 85% on prior calendar period. We also got a glimpse of current trading, with July month to date revenue growth accelerated to +39%. We expect TPW to report a tremendous uplift in gross profit, enabling significant reinvestment in FY22. Savings rate still elevated Internet data usage swelling Solid demand for cars We have seen very strong profit results and growing forward order books from dealers like Eagers Automotive (APE) and Autosports (ASG) - both companies' share prices have appreciated over the previous 12 months, at 145% and 118% respectively. APE's "order bank growth is expected to continue as new vehicle demand remains strong and vehicle supply remains constrained"[3]. Source: Morgans, ABS
Weak travel results "It's not for lack of trying. Australians are ready to travel. Qantas Chief Customer Officer, Stephanie Tully, commented: "So we [have] obviously been researching our customers throughout the pandemic on their desire to travel and doing that monthly and in the last couple of months, particularly for international, we've seen the highest demand levels we've ever seen. When you compare that to pre-pandemic levels of people that are likely to travel in the next 12 months, we're seeing triple the amount of people looking to travel internationally in the next 12 months." Aircraft are being pulled out of storage, including the A380s, and reconfigurations are currently underway with the intention to return to the skies when the magical 70% and then 80% vaccination rates are achieved. Bolstering management's confidence was the strength of the domestic business in the June quarter of FY21 - by the end of June, management basically saw the domestic business booking curves back to pre-COVID levels. Concerning inventory levels Everyone seems to want to 'invest' in inventory as a strategic play. A stretched global manufacturing and supply chain is creating challenges - including longer lead times, higher freight costs and shipping delays - leading to companies growing inventory levels. Supercheap Retail (SUL) management said: "If it's [inventory is] not in the shed or on the shelf today, for Christmas this year I think the chance of it being [in stock] come that peak time is incredibly remote."[7] However, we do not want inventory growth outstripping sales growth, and this is something we'll watching closely in future periods. Retailers (BRG, SUL, KGN) continue to show higher levels of inventory and it's concerning us. Only JBH and BBN have managed to keep inventory days down so far. Whether customers will be the major beneficiaries of heightened promotion activity (for inventory vulnerable to obsolescence such as technology) remains unknown; only time will tell. What does all this mean for the future?
Department of Health We predict the 70% threshold for vaccinations will be reached by the end of October, which will be around the same time as AGM season. Our view is CEOs will start to get more optimistic around this event. This is likely going to continue the rotation towards coronavirus-impacted sectors. The Kardinia portfolio is positioned for re-opening, with stocks that benefit from this comprising ~30% of the long book and lockdown stocks only ~10%. We believe some themes, such as the shift to online, are enduring, and we continue to hold exposure to the technology sector. Of course, new COVID variants and government nervousness around a likely rising death rate (as witnessed overseas) present risks to our view, but the Kardinia fund's ability to shift its net exposure to markets in a range of -25% to +75% allows us to quickly respond to any change in outlook. |
|
Funds operated by this manager: Bennelong Kardinia Absolute Return Fund |
|
[1] Booktopia FY21 Results Presentation [2] Uniti Group FY21 Results Presentation [3] Eagers Automotive FY21 Results Presentation [4] Bluescope FY21 Results Presentation [5] Rex FY21 Results Presentation [6] Qantas FY21 Earnings Call [7] 'Zero chances of it arriving on time', Sydney Morning Herald, 22 August 2021 |


15 Sep 2021 - New Funds on Fundmonitors.com
|
New Funds on Fundmonitors.com |
|
Below are some of the funds we've recently added to our database. Follow the links to view each fund's profile, where you'll have access to their offer documents, monthly reports, historical returns, performance analytics, rankings, research, platform availability, and news & insights. |
|
|
||||||||||||||||||||
|
||||||||||||||||||||
|
|
||||||||||||||||||||
|
||||||||||||||||||||
| View Profile | ||||||||||||||||||||
|
|
||||||||||||||||||||
|
||||||||||||||||||||
| View Profile | ||||||||||||||||||||
|
|
||||||||||||||||||||
|
||||||||||||||||||||
| View Profile | ||||||||||||||||||||
|
|
||||||||||||||||||||
|
||||||||||||||||||||
| View Profile | ||||||||||||||||||||
|
|
||||||||||||||||||||
|
||||||||||||||||||||
| View Profile | ||||||||||||||||||||
|
|
||||||||||||||||||||
|
||||||||||||||||||||
| View Profile | ||||||||||||||||||||
|
||||||||||||||||||||
| View Profile | ||||||||||||||||||||


|
Want to see more funds? |
|
Subscribe for full access to these funds and over 600 others |

14 Sep 2021 - Performance Report: 4D Global Infrastructure Fund
| Report Date | |
| Manager | |
| Fund Name | |
| Strategy | |
| Latest Return Date | |
| Latest Return | |
| Latest 6 Months | |
| Latest 12 Months | |
| Latest 24 Months (pa) | |
| Annualised Since Inception | |
| Inception Date | |
| FUM (millions) | |
| Fund Overview | The fund is managed as a single portfolio including regulated utilities in gas, electricity and water, transport infrastructure such as airports, ports, road and rail, as well as communication assets such as the towers and satellite sectors. The portfolio is intended to have exposure to both developed and emerging market opportunities, with country risk assessed internally before any investment is considered. The maximum absolute position of an individual stock is 7% of the fund. |
| Manager Comments | The fund's returns over the past 12 months have been achieved with a volatility of 11.87% vs the index's 14.03%. The annualised volatility of the fund's returns since inception in March 2016 is 12.26% vs the index's 15.89%. Over all other periods, the fund's returns have been consistently less volatile than the index. The fund's down-capture ratio for returns since inception is 55.14%. Over all other periods, the fund's down-capture ratio has ranged from a high of 61.76% over the most recent 24 months to a low of 46.28% over the latest 12 months. A down-capture ratio less than 100% indicates that, on average, the fund has outperformed in the market's negative months over the specified period. |
| More Information |

14 Sep 2021 - Performance Report: Surrey Australian Equities Fund
| Report Date | |
| Manager | |
| Fund Name | |
| Strategy | |
| Latest Return Date | |
| Latest Return | |
| Latest 6 Months | |
| Latest 12 Months | |
| Latest 24 Months (pa) | |
| Annualised Since Inception | |
| Inception Date | |
| FUM (millions) | |
| Fund Overview | The Investment Manager follows a defined investment process which is underpinned by detailed bottom up fundamental analysis, overlayed with sectoral and macroeconomic research. This is combined with an extensive company visitation program where we endeavour to meet with company management and with other stakeholders such as suppliers, customers and industry bodies to improve our information set. Surrey Asset Management defines its investment process as Qualitative, Quantitative and Value Latencies (QQV). In essence, the Investment Manager thoroughly researches an investment's qualitative and quantitative characteristics in an attempt to find value latencies not yet reflected in the share price and then clearly defines a roadmap to realisation of those latencies. Developing this roadmap is a key step in the investment process. By articulating a clear pathway as to how and when an investment can realise what the Investment Manager sees as latent value, defines the investment proposition and lessens the impact of cognitive dissonance. This is undertaken with a philosophical underpinning of fact-based investing, transparency, authenticity and accountability. |
| Manager Comments | The fund's Sortino ratio (which excludes volatility in positive months) has ranged from a high of 6.86 for performance over the most recent 12 months to a low of 0.88 over the latest 36 months, and is 0.89 for performance since inception. By contrast, the ASX 200 Total Return Index's Sortino for performance since June 2018 is 0.75. Since inception in June 2018 in the months where the market was positive, the fund has provided positive returns 83% of the time, contributing to an up-capture ratio for returns since inception of 123.38%. Over all other periods, the fund's up-capture ratio has ranged from a high of 142.61% over the most recent 24 months to a low of 92.95% over the latest 12 months. An up-capture ratio greater than 100% indicates that, on average, the fund has outperformed in the market's positive months. |
| More Information |

14 Sep 2021 - The Rise of the Contactless Economy - A Global Megatrend
|
Covid-19 has created an unprecedented global change in how we pay for things. There's been a profound and permanent change in behaviour in Australia and many parts of the world. Payment apps are easy to use, they offer improved security and the work from home offers balance introduced since Covid means more time to browse from home via laptops and phones, says John Lobb Insync's Portfolio Manager, John Lobb tells us more on The Rise of the Contactless Economy Megatrend. Funds operated by this manager: Insync Global Capital Aware Fund, Insync Global Quality Equity Fund |
14 Sep 2021 - 10k Words - September Edition
|
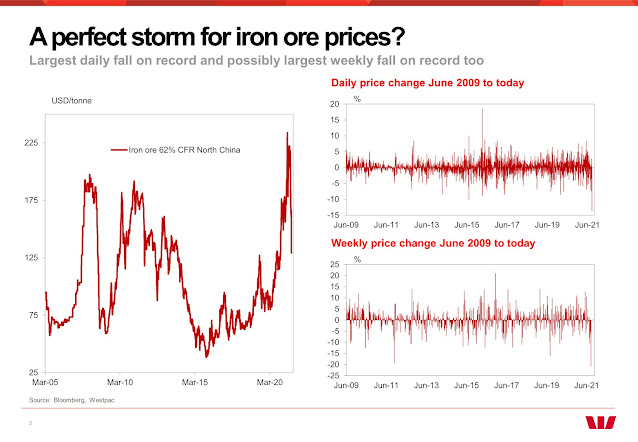
10k Words - September 2021 Equitable Investors 8 September 2021 Apparently, Confucius didn't say "One Picture is Worth Ten Thousand Words" after all. It was an advertisement in a 1920s trade journal for the use of images in advertisements on the sides of streetcars. Even without the credibility of Confucius behind it, we think this saying has merit. Each month we share a few charts or images we consider noteworthy. We kick off with Equitable Investors' updated study on the distribution of five year returns for ASX-listed industrials. The FT highlights the recent surge in global M&A activity. Leading electronics retailer JB Hi-Fi (JBH) suffered a decline in like-for-like sales amid COVID-19 lockdowns in eastern Australia, ending a long sequence of continual growth, as charted by Evans & Partners. And Wilsons shows how ASX stocks were divided into the winners and losers as the latest round of lockdowns in Sydney and Melbourne were initiated. Westpac highlights how volatile iron ore spot prices have become - at the same time the cost of shipping that ore has surged, as illustrated by a Bloomberg chart of the shipping benchmark the Baltic Exchange Dry Index. Finally, Hussman Funds reckons the ratio of non-financial market capitalization to corporate gross value-added (MarketCap/GVA) is "the single most reliable valuation measure we've introduced over time, based on its correlation with actual subsequent market returns across history".
Distribution of five year total returns for ASX industrials
Source: Equitable Investors, Sentieo Worldwide M&A
Source: FT.com, Refinitiv Like-for-like sales growth for JB Hi-Fi (JBH) & subsidiary The Good Guys turns negative
Source: Evans & Partners ASX COVID-19 winners v. losers Source: Wilsons Largest daily fall on record for iron ore spot market - and largest weekly fall too
Source: Westpac Baltic Exchange Dry Index
Source: Bloomberg US market cap / gross value add for non-financials v subsequent 12-year S&P 500 returns Source: Hussman Funds US market cap / gross value add for non-financials Source: Hussman Funds Disclaimer Nothing in this blog constitutes investment advice - or advice in any other field. Neither the information, commentary or any opinion contained in this blog constitutes a solicitation or offer by Equitable Investors Pty Ltd (Equitable Investors) or its affiliates to buy or sell any securities or other financial instruments. Nor shall any such security be offered or sold to any person in any jurisdiction in which such offer, solicitation, purchase, or sale would be unlawful under the securities laws of such jurisdiction. The content of this blog should not be relied upon in making investment decisions.Any decisions based on information contained on this blog are the sole responsibility of the visitor. In exchange for using this blog, the visitor agree to indemnify Equitable Investors and hold Equitable Investors, its officers, directors, employees, affiliates, agents, licensors and suppliers harmless against any and all claims, losses, liability, costs and expenses (including but not limited to legal fees) arising from your use of this blog, from your violation of these Terms or from any decisions that the visitor makes based on such information. This blog is for information purposes only and is not intended to be relied upon as a forecast, research or investment advice. The information on this blog does not constitute a recommendation, offer or solicitation to buy or sell any securities or to adopt any investment strategy. Although this material is based upon information that Equitable Investors considers reliable and endeavours to keep current, Equitable Investors does not assure that this material is accurate, current or complete, and it should not be relied upon as such. Any opinions expressed on this blog may change as subsequent conditions vary. Equitable Investors does not warrant, either expressly or implied, the accuracy or completeness of the information, text, graphics, links or other items contained on this blog and does not warrant that the functions contained in this blog will be uninterrupted or error-free, that defects will be corrected, or that the blog will be free of viruses or other harmful components.Equitable Investors expressly disclaims all liability for errors and omissions in the materials on this blog and for the use or interpretation by others of information contained on the blog Funds operated by this manager: |
.jpg)
.jpg)
.jpg)
.png)
.jpg)
.png)
.png)

13 Sep 2021 - Performance Report: Cyan C3G Fund
| Report Date | |
| Manager | |
| Fund Name | |
| Strategy | |
| Latest Return Date | |
| Latest Return | |
| Latest 6 Months | |
| Latest 12 Months | |
| Latest 24 Months (pa) | |
| Annualised Since Inception | |
| Inception Date | |
| FUM (millions) | |
| Fund Overview | Cyan C3G Fund is based on the investment philosophy which can be defined as a comprehensive, clear and considered process focused on delivering growth. These are identified through stringent filter criteria and a rigorous research process. The Manager uses a proprietary stock filter in order to eliminate a large proportion of investments due to both internal characteristics (such as gearing levels or cash flow) and external characteristics (such as exposure to commodity prices or customer concentration). Typically, the Fund looks for businesses that are one or more of: a) under researched, b) fundamentally undervalued, c) have a catalyst for re-rating. The Manager seeks to achieve this investment outcome by actively managing a portfolio of Australian listed securities. When the opportunity to invest in suitable securities cannot be found, the manager may reduce the level of equities exposure and accumulate a defensive cash position. Whilst it is the company's intention, there is no guarantee that any distributions or returns will be declared, or that if declared, the amount of any returns will remain constant or increase over time. The Fund does not invest in derivatives and does not use debt to leverage the Fund's performance. However, companies in which the Fund invests may be leveraged. |
| Manager Comments | The fund's Sortino ratio (which excludes volatility in positive months) has ranged from a high of 1.38 for performance over the most recent 12 months to a low of 0.28 over the latest 36 months, and is 1.25 for performance since inception. By contrast, the ASX Small Ordinaries Total Return Index's Sortino for performance since August 2014 is 0.72. The fund's down-capture ratio for returns since inception is 51.75%. Over all other periods, the fund's down-capture ratio has ranged from a high of 123.68% over the most recent 12 months to a low of 79.59% over the latest 60 months. A down-capture ratio less than 100% indicates that, on average, the fund has outperformed in the market's negative months over the specified period. |
| More Information |

13 Sep 2021 - Performance Report: DS Capital Growth Fund
| Report Date | |
| Manager | |
| Fund Name | |
| Strategy | |
| Latest Return Date | |
| Latest Return | |
| Latest 6 Months | |
| Latest 12 Months | |
| Latest 24 Months (pa) | |
| Annualised Since Inception | |
| Inception Date | |
| FUM (millions) | |
| Fund Overview | The investment team looks for industrial businesses that are simple to understand; they generally avoid large caps, pure mining, biotech and start-ups. They also look for: - Access to management; - Businesses with a competitive edge; - Profitable companies with good margins, organic growth prospects, strong market position and a track record of healthy dividend growth; - Sectors with structural advantage and barriers to entry; - 15% p.a. pre-tax compound return on each holding; and - A history of stable and predictable cash flows that DS Capital can understand and value. |
| Manager Comments | The fund's returns over the past 12 months have been achieved with a volatility of 6.85% vs the index's 10.33%. The annualised volatility of the fund's returns since inception in January 2013 is 11.12% vs the index's 13.55%. Over all other periods, the fund's returns have been consistently less volatile than the index. The fund's Sharpe ratio has ranged from a high of 3.99 for performance over the most recent 12 months to a low of 1.01 over the latest 60 months, and is 1.33 for performance since inception. By contrast, the ASX 200 Total Return Index's Sharpe for performance since January 2013 is 0.67. Since inception in January 2013 in the months where the market was positive, the fund has provided positive returns 91% of the time, contributing to an up-capture ratio for returns since inception of 73.67%. Over all other periods, the fund's up-capture ratio has ranged from a high of 120.64% over the most recent 24 months to a low of 87.73% over the latest 60 months. An up-capture ratio greater than 100% indicates that, on average, the fund has outperformed in the market's positive months. The fund has a down-capture ratio for returns since inception of 45%. Over all other periods, the fund's down-capture ratio has ranged from a high of 73.41% over the most recent 36 months to a low of 15.64% over the latest 12 months. A down-capture ratio less than 100% indicates that, on average, the fund has outperformed in the market's negative months. |
| More Information |