
NEWS

12 Sep 2025 - Turning Turbulence into Triumph: Two Stocks Mastering Market Themes
|
Turning Turbulence into Triumph: Two Stocks Mastering Market Themes Alphinity Investment Management June 2025 6 minutes read time |
|
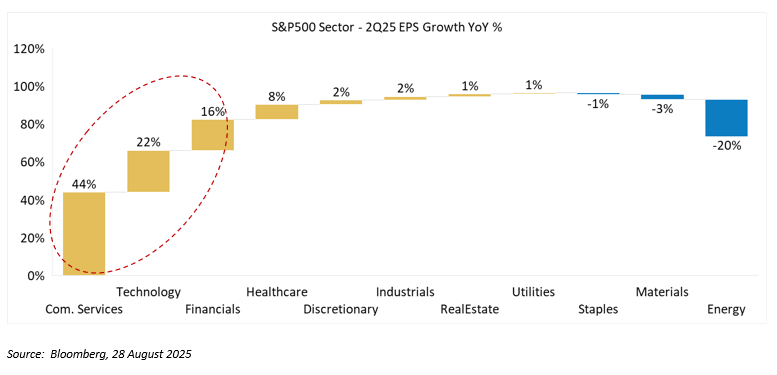
Five powerful themes are reshaping the investment landscape, creating winners and losers across global markets. The AI revolution stands as the defining narrative, driving fundamental shifts in capital allocation and valuation frameworks. Lower interest rate expectations and regulatory reform have reignited investor confidence, while Trump's tariff agenda injects supply chain uncertainty and continues to impact both corporate margins and consumer spending power. Meanwhile, geopolitical tensions fuel unprecedented defence spending and strategic consolidation as companies position for an increasingly fragmented world. These converging forces created a tale of two markets during 2Q25 earnings season. On the surface, the numbers appeared robust: over 80% of US companies beat earnings expectations, guidance upgrades accelerated to double the 1Q25 rate, and consensus pushed earnings growth forecasts to an impressive 11% and 13% for 2025 and 2026 respectively. Yet beneath this veneer of strength lay a more complex reality. Earnings growth concentrated heavily within just three sectors and performance diverged sharply among industry peers. This bifurcated landscape has created an unforgiving environment where execution excellence separates winners from casualties. Companies skilfully navigating these themes are thriving, while those stumbling face harsh consequences. Two high quality companies with underappreciated earnings potential that exemplify this successful navigation are Amphenol and O'Reilly Automotive, transforming market complexity into competitive advantages and turning potential headwinds into powerful tailwinds through exceptional strategic execution. US 2Q25 Reporting Season - Strong overall growth of 12%, but largely driven by 3 sectors
Five Themes Defining Corporate PerformanceThe recent reporting season once again highlighted these five powerful themes that continue to reshape the investment landscape and define how companies are adapting to the current environment. Below, we examine how these themes have evolved and intensified through the latest earnings cycle:
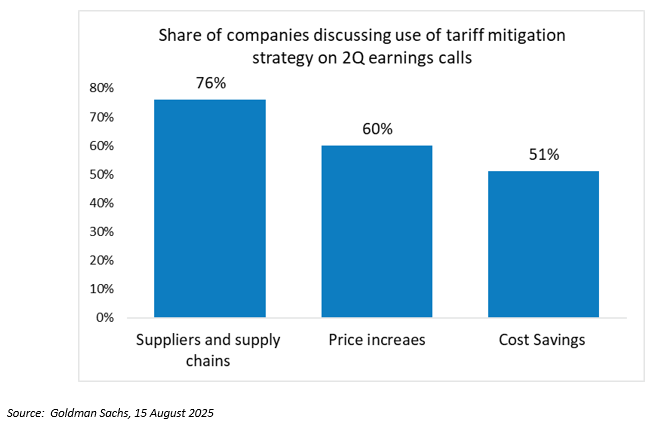
Increased confidence in corporates' ability to mitigate tariff headwinds
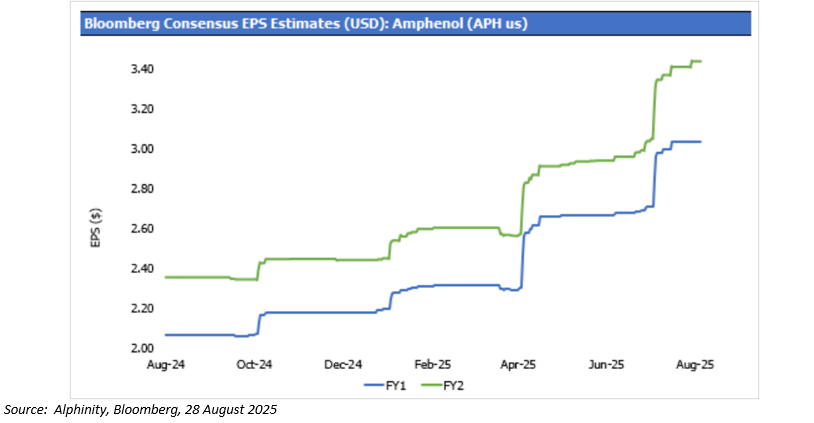
Quality in Action: Two Exceptional OperatorAmong the winners emerging from this challenging environment, two companies showcase exceptional strategic positioning across multiple themes. Amphenol and O'Reilly Automotive have not merely survived current market forces--they have actively leveraged them to strengthen their competitive moats, accelerate growth, and deliver consistent outperformance through disciplined execution and opportunistic capital deployment. Amphenol: Wired for AI, Armed for Defence, Primed for M&AAmphenol, a leading connector and fibre optics supplier with 12% global market share, sits perfectly at the intersection of three key themes: AI infrastructure buildout, defence spending acceleration, and strategic M&A activity. AI Content Multiplication Amphenol expects to grow at 2x their end markets due to significant content uplift in AI applications. Unlike traditional data centres , AI requires every chip to be interconnected, creating multiples of connections. This structural advantage delivered exceptional Q2 2025 results--revenue beat expectations by 11% and EPS by 21%. Management noted AI customers "continue to spend with no one slowing down investments." Strategic M&A Execution The $10.5 billion CCS acquisition exemplifies Amphenol's disciplined M&A approach in today's active dealmaking environment. Acquired at a reasonable 11x EBITDA, CCS brings $3.6 billion in expected 2025 sales at 26% EBITDA margins. The deal adds complementary fibre capabilities with minimal overlap to existing operations. With leverage remaining under 2x and management's proven integration track record (13% annual revenue growth over five years, 2x their end markets), this represents smart capital deployment in an M&A-friendly market. Defence Expansion The $300 million acquisition of Narda-MITEQ, a leading provider of active RF and microwave components, expands Amphenol's existing defence exposure. This positioning capitalizes on unprecedented global defence spending increases driven by geopolitical tensions and deglobalization trends. Structural Margin Expansion Management raised conversion margin targets from 25% to 30%, citing better pricing power as technology complexity increases. This adds a new earnings growth lever beyond their traditional organic growth, M&A, and buyback strategy. Attractive Valuation Trading at 30x CY26 EPS versus the S&P 500's 21x, Amphenol's market premium sits at the lower end of its historical 40-85% range despite earnings growing 40-50% above average years. The combination of AI content multiplication, strategic M&A execution, and defence market expansion positions Amphenol as a clear beneficiary of three of today's dominant investment themes. Amphenol - Strong earnings upgrade cycle underpinned by multiple growth levers and pricing power
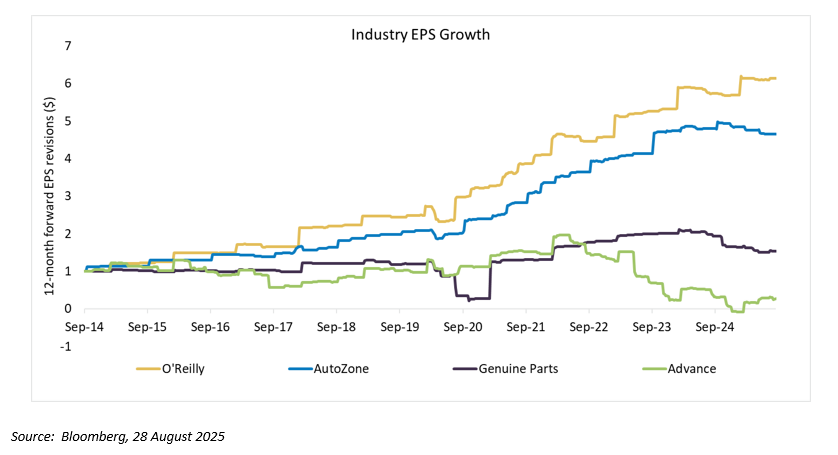
O'Reilly's Wide Consumer Moat Meets Supply Chain MasteryO'Reilly demonstrates how best-in-class operators are able to turn challenging conditions into competitive advantages. As a leader in the automotive aftermarket industry with 6,200 stores, the company benefits from non-discretionary vehicle maintenance demand while demonstrating superior tariff navigation. A Resilient Industry The automotive aftermarket's structural advantages shine during uncertainty. Vehicle repairs remain essential regardless of economic pressures, with aging U.S. vehicle fleets and rising light truck penetration driving sustained demand. O'Reilly's dual-market strategy serves both DIY consumers (52% of sales) and professional mechanics (48% of sales), providing diversified exposure to recession-resistant spending. Tariff Management Excellence With 20-30% of costs sourced from China and 10-15% from Mexico, O'Reilly faces meaningful tariff exposure but has demonstrated exceptional pass-through ability. Same-SKU inflation accelerated from 0.5% in Q1 to 1.5% in Q2 2025, with management seeing "substantially more" pricing power potential than currently embedded in guidance. Solid Execution O'Reilly delivered strong second-quarter 2025 earnings, growing comparative sales by 4.1% (beating expectations of 3.7%) and expanding its gross margin by 70 basis points. Despite elevated SG&A spending, management raised full-year comparative growth guidance to 3-4.5% from prior 2-4%, suggesting conservative positioning with upside potential. Widening Competitive Moat O'Reilly's unrivalled distribution network--30 distribution centres and 385 hub stores enabling 5-night weekly delivery--provides superior service versus struggling competitors. With NAPA facing operational challenges and Advance Auto Parts in financial restructuring, O'Reilly is well positioned to continue capturing market share in a consolidating industry. The combination of defensive demand, tariff-induced pricing tailwinds, and market share opportunities positions O'Reilly for sustained outperformance as macro headwinds become competitive advantages. O'Reilly enjoying superior earnings growth relative to key peers over the last decade
Navigating Complexity Through Strategic SelectionToday's investment landscape rewards execution excellence while punishing missteps, as these five forces--AI implementation, defence modernisation, tariff adaptation, strategic M&A, and consumer resilience--create clear winners and losers even within sectors. Success requires identifying companies that transform these forces into competitive advantages. Amphenol capitalizes on AI content multiplication and executes disciplined defence acquisitions, while O'Reilly turns tariff headwinds and consumer pressure into earnings and market share gains. As earnings dispersion widens and market patience diminishes, broad sector exposure is insufficient. Investors must focus on best-in-class operators with proven execution capabilities and structural competitive advantages. In this bifurcated environment, owning quality companies like Amphenol and O'Reilly provides both defensive characteristics and offensive growth potential, positioning portfolios to benefit from, rather than merely endure, the forces reshaping the global economy. Editorial Note: |
|
Funds operated by this manager: Alphinity Australian Share Fund , Alphinity Concentrated Australian Share Fund , Alphinity Sustainable Share Fund , Alphinity Global Equity Fund , Alphinity Global Sustainable Equity Fund This material has been prepared by Alphinity Investment Management ABN 12 140 833 709 AFSL 356 895 (Alphinity). It is general information only and is not intended to provide you with financial advice or take into account your objectives, financial situation or needs. To the extent permitted by law, no liability is accepted for any loss or damage as a result of any reliance on this information. Any projections are based on assumptions which we believe are reasonable but are subject to change and should not be relied upon. Past performance is not a reliable indicator of future performance. Neither any particular rate of return nor capital invested are guaranteed. |

11 Sep 2025 - The investment case for Anta Sports: Who'd have thought Fila was alive and well?!

10 Sep 2025 - Volatility insights
|
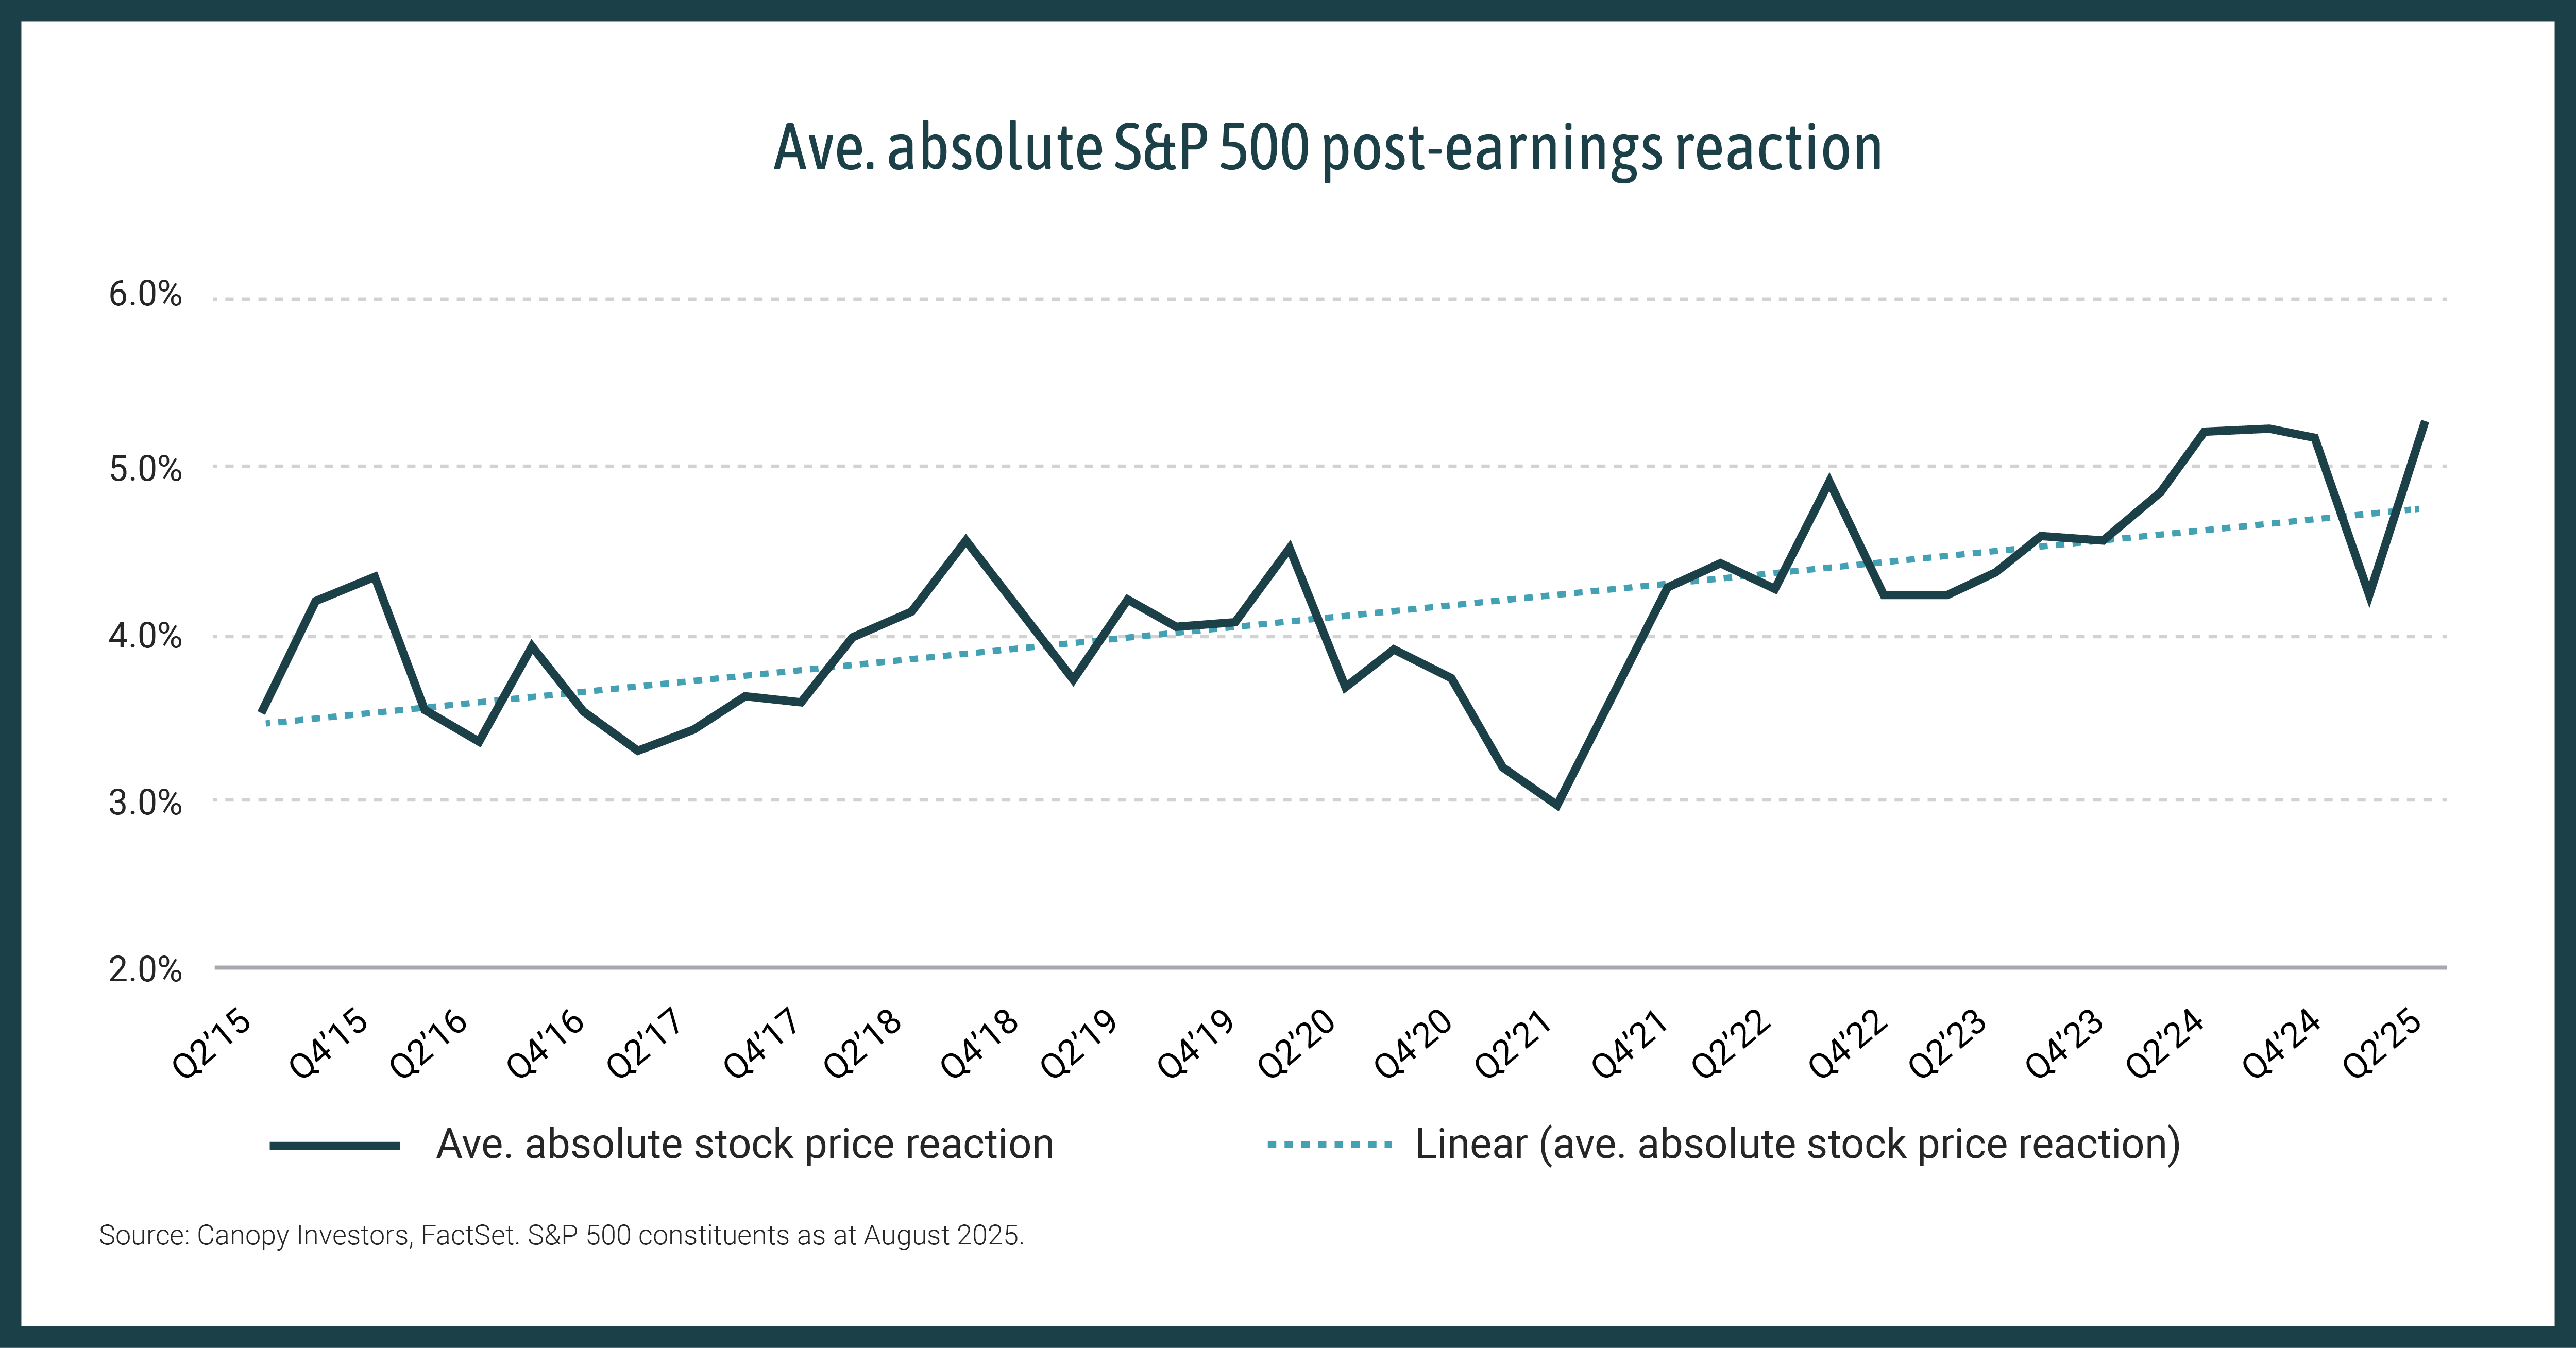
Volatility insights Canopy Investors August 2025 2 min read If you think share prices are becoming more volatile during earnings season, you're not imagining it. This is true both in Australia, where we've seen some large moves in big companies, as well as in the US. As shown below, we estimate that the average post-earnings reaction for S&P 500 companies is now more than ±5%, a significant increase compared with a decade ago. The frequency of ±10% post-earnings moves has also doubled. Why is this happening?There are a few potential explanations:
These trends are long-term and likely structural - the new normal. For long-term investors, the opportunity lies in harnessing this volatility to their advantage.
|
|
Funds operated by this manager: |

9 Sep 2025 - New Funds on Fundmonitors.com
|
New Funds on FundMonitors.com |
|
Below are some of the funds we've recently added to our database. Follow the links to view each fund's profile, where you'll have access to their offer documents, monthly reports, historical returns, performance analytics, rankings, research, platform availability, and news & insights. |
 |
||||||||||||||||||||||
| PCG Diversified New Zealand Private Debt Fund | ||||||||||||||||||||||
|
||||||||||||||||||||||
| View Profile | ||||||||||||||||||||||
 |
||||||||||||||||||||||
| Perennial Strategic Natural Resources Trust | ||||||||||||||||||||||
|
||||||||||||||||||||||
| View Profile | ||||||||||||||||||||||
 |
||||||||||||||||||||||
| Paradice Australian Small Cap Opportunities Fund - Class A | ||||||||||||||||||||||
|
||||||||||||||||||||||
| View Profile | ||||||||||||||||||||||
|
|
||||||||||||||||||||||
| Merewether Capital Inception Fund | ||||||||||||||||||||||
|
||||||||||||||||||||||
 |
||||||||||||||||||||||
| Orbis Emerging Markets Equity Fund | ||||||||||||||||||||||
|
||||||||||||||||||||||
| View Profile | ||||||||||||||||||||||
|
Want to see more funds? |
||||||||||||||||||||||
|
Subscribe for full access to these funds and over 900 others |

8 Sep 2025 - Manager Insights | Altor Capital
|
Chris Gosselin, CEO of FundMonitors.com, speaks with Benjamin Harrison, Chief Investment Officer at Altor Capital. In this conversation, Ben shares how the Altor AltFi Income Fund has delivered consistent performance over seven years, combining private credit investments with unique equity kickers. He also discusses their hands-on approach, focus on mid-market corporates, and where he sees the greatest opportunities for growth-making this a valuable watch for investors interested in private credit. |
|||
|
|||
|
|
|||

5 Sep 2025 - What the Fed's shift from inflation to employment means for investors
|
What the Fed's shift from inflation to employment means for investors Pendal August 2025 |
|
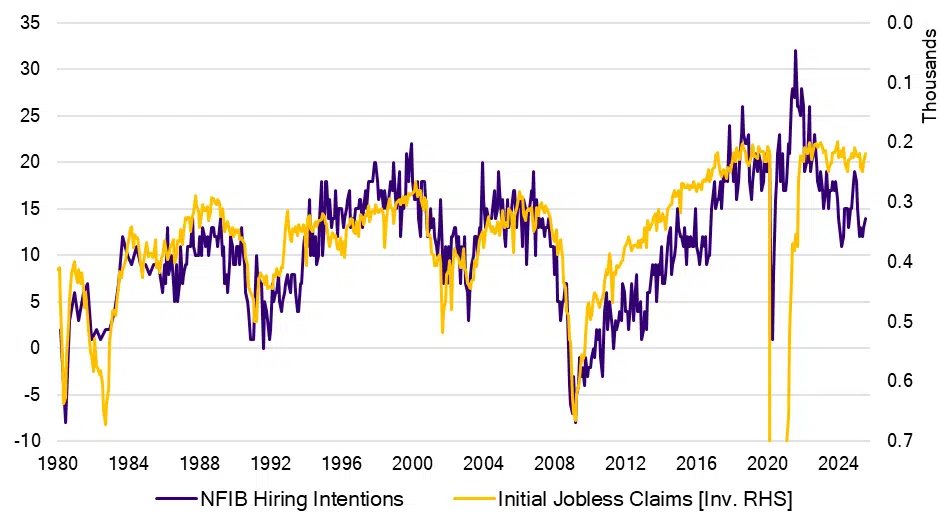
SINCE December 2018, we've known Fed chair Jay Powell is not afraid to pivot. Back then the Fed hiking cycle was forced to an abrupt halt when the US economy came under the strain of the first round of Trump's trade tariffs. By the following October, the Fed had cut rates by 75 percentage points to 1.75%. Powell's latest comments at last weekend's Fed's annual gathering in Jackson Hole, Wyoming, may prove to be another example. In his speech, Powell acknowledged downside risks to employment, suggested further easing from the current "restrictive" policy stance may be appropriate and - for the first time in months - did not make this conditional on the inflation outlook. Since these remarks, the US bond market has priced in an 85% chance of a cut at the next Federal Open Market Committee meeting in September. This would take the upper bound of the Fed Funds target rate to 4.25%. Sceptics view the move as Jay Powell bending to political pressure from President Trump. The chart below suggests the Fed ought to be getting a little more worried. US hiring and firing: NFIB Hiring Intentions and Initial Jobless Claims
Source: BloombergThe purple line shows the hiring intentions of US businesses, according to a monthly survey by the National Federation of Independent Business. The yellow line is an inverted series of US initial jobless claims - a weekly series to reflect new joblessness. The long-standing relationship between the purple and yellow lines is clear to see, and intuitive to grasp. When businesses stop hiring, they eventually have to start firing. And vice versa. When businesses feel the bottom is in, they stop firing, and then they start hiring. This relationship seems to have dislocated of late. We need more time to see whether this is an actual dislocation, or one of those blips in the long-run data. A possible explanation? Perhaps businesses sense the slowdown and have paused hiring, but burned by the post-Covid labour shortages, are not yet willing to let people go. A likely rate cutSeptember will likely bring a rate cut from the Fed. Pendal's analysis of the long-term decision-making bias of the Fed leans heavily on market pricing. In other words, the Fed doesn't like to surprise or disappoint (unlike some other central banks we know). That analysis also shows how sensitive the Committee is to labour-market dynamics. If the Fed has now pivoted its focus from inflation to employment, we too should be looking at the best leading indicators for where labour markets are headed. |
|
Funds operated by this manager: Pendal MicroCap Opportunities Fund , Pendal Global Select Fund - Class R , Pendal Sustainable Australian Fixed Interest Fund - Class R , Pendal Focus Australian Share Fund , Pendal Horizon Sustainable Australian Share Fund , Regnan Credit Impact Trust Fund , Pendal Sustainable Australian Share Fund , Pendal Sustainable Balanced Fund - Class R , Pendal Multi-Asset Target Return Fund |
|
This information has been prepared by Pendal Fund Services Limited (PFSL) ABN 13 161 249 332, AFSL No 431426 and is current as at December 8, 2021. PFSL is the responsible entity and issuer of units in the Pendal Multi-Asset Target Return Fund (Fund) ARSN: 623 987 968. A product disclosure statement (PDS) is available for the Fund and can be obtained by calling 1300 346 821 or visiting www.pendalgroup.com. The Target Market Determination (TMD) for the Fund is available at www.pendalgroup.com/ddo. You should obtain and consider the PDS and the TMD before deciding whether to acquire, continue to hold or dispose of units in the Fund. An investment in the Fund or any of the funds referred to in this web page is subject to investment risk, including possible delays in repayment of withdrawal proceeds and loss of income and principal invested. This information is for general purposes only, should not be considered as a comprehensive statement on any matter and should not be relied upon as such. It has been prepared without taking into account any recipient's personal objectives, financial situation or needs. Because of this, recipients should, before acting on this information, consider its appropriateness having regard to their individual objectives, financial situation and needs. This information is not to be regarded as a securities recommendation. The information may contain material provided by third parties, is given in good faith and has been derived from sources believed to be accurate as at its issue date. While such material is published with necessary permission, and while all reasonable care has been taken to ensure that the information is complete and correct, to the maximum extent permitted by law neither PFSL nor any company in the Pendal group accepts any responsibility or liability for the accuracy or completeness of this information. Performance figures are calculated in accordance with the Financial Services Council (FSC) standards. Performance data (post-fee) assumes reinvestment of distributions and is calculated using exit prices, net of management costs. Performance data (pre-fee) is calculated by adding back management costs to the post-fee performance. Past performance is not a reliable indicator of future performance. Any projections are predictive only and should not be relied upon when making an investment decision or recommendation. Whilst we have used every effort to ensure that the assumptions on which the projections are based are reasonable, the projections may be based on incorrect assumptions or may not take into account known or unknown risks and uncertainties. The actual results may differ materially from these projections. For more information, please call Customer Relations on 1300 346 821 8am to 6pm (Sydney time) or visit our website www.pendalgroup.com |

4 Sep 2025 - Climate-related Financial Disclosures: A step toward greater transparency in corporate sustainabilit
|
Climate-related Financial Disclosures: A step toward greater transparency in corporate sustainabilit Janus Henderson Investors August 2025 Liz Harrison, Fixed Interest Strategist - ESG in the Australian Fixed Interest team, discusses the Climate-related Financial Disclosure initiative and how the mandated sustainability reports will be used to enhance transparency and accountability. Sustainability reporting thresholds by group
Source: Janus Henderson, Australian Accounting Standards Board (AASB) Australia has joined many global counterparts by introducing mandatory sustainability reporting for companies and other select legal entities. This initiative, the Climate-related financial disclosure (CRFD), was mandated by the Australian Government in partnership with the key regulator Australian Securities and Investments Commission (ASIC). CRFD began at the start of 2025 and will be implemented over a three-year period. Larger companies are required to comply first, with the following criteria set for mandatory reporting by the end of the third year:
For asset owners, mandatory reporting will apply only to those with at least $5 billion in assets under management (AUM) and that are registered schemes, registrable superannuation entities, or retail corporate collective investment vehicles (CCIV). This requirement for asset owners will commence in Group 2, starting after July 1, 2026. The timing for the release of these reports will be aligned with the start of a company's or asset manager's financial year reporting. The earliest reports from the first group are expected at the beginning of 2026, applicable to those whose reporting period aligns with the calendar year. While this new regulation will become a legal requirement, many companies have already been doing voluntary reporting in their sustainability reports. It has been reported that this is the case for 82% of the ASX2001. For those not familiar with these sustainability reports, they are comprehensive documents, often extending to 100 pages, that ESG professionals spend hours reading through. They provide valuable insights into a company's environmental targets, performance and initiatives, alongside information on employee welfare such as gender pay equality, workplace diversity, staff retention, and charitable contributions. What Information is required in the mandatory sustainability reports?First year requirements include:
Sustainability reports must be included within a company's annual report or linked to a separate sustainability report embedded within the annual report. Second year expansion: From discussions we have had with companies, it is evident that data is still difficult to obtain, with some sectors having no set methodology for reporting of emissions. For example, Rabobank shared how they issue carbon calculators to farmers in their loan book, whereas Nestle are often using Sustainability NGOs to build out their primary data from within their supply chain. Our sense is that it is difficult to have good visibility and confidence in obtaining correct data, but we believe this will evolve. First three years: From 2028, directors will assume full liability for these disclosures. What is climate data useful for and how will practitioners use these reports?As a fixed income investor, data and disclosures in these reports often help steer our questions to an issuer during company engagement. The information helps us home in on the areas where the company might be underperforming against their peers, or is not on track to meet their targets. There are some industries where it is obvious as to what climate risks are - for example, those with high carbon footprints and in 'hard to abate' sectors such as energy, mining and airline companies. For other companies, it's essential to delve deeper into the sources of their emissions, particularly the components of their scope 3 emissions, and assess the measures they are taking to reduce them. We are interested to know whether the company has a credible pathway for decarbonisation, have they set targets, are they on track to meet them, how are they reporting and how are they engaging with their supply chain, amongst other things. Our ESG due diligence starts through analysing the data, reading the company's own sustainability reports and examining third party research reports. This will form the basis of our questions during company engagements and help us assess the ESG risks of a company and the mitigation strategies in play. It all forms part of our ESG integration in the investment portfolios we manage. How do we capture ESG metrics for issuers in our portfolio?
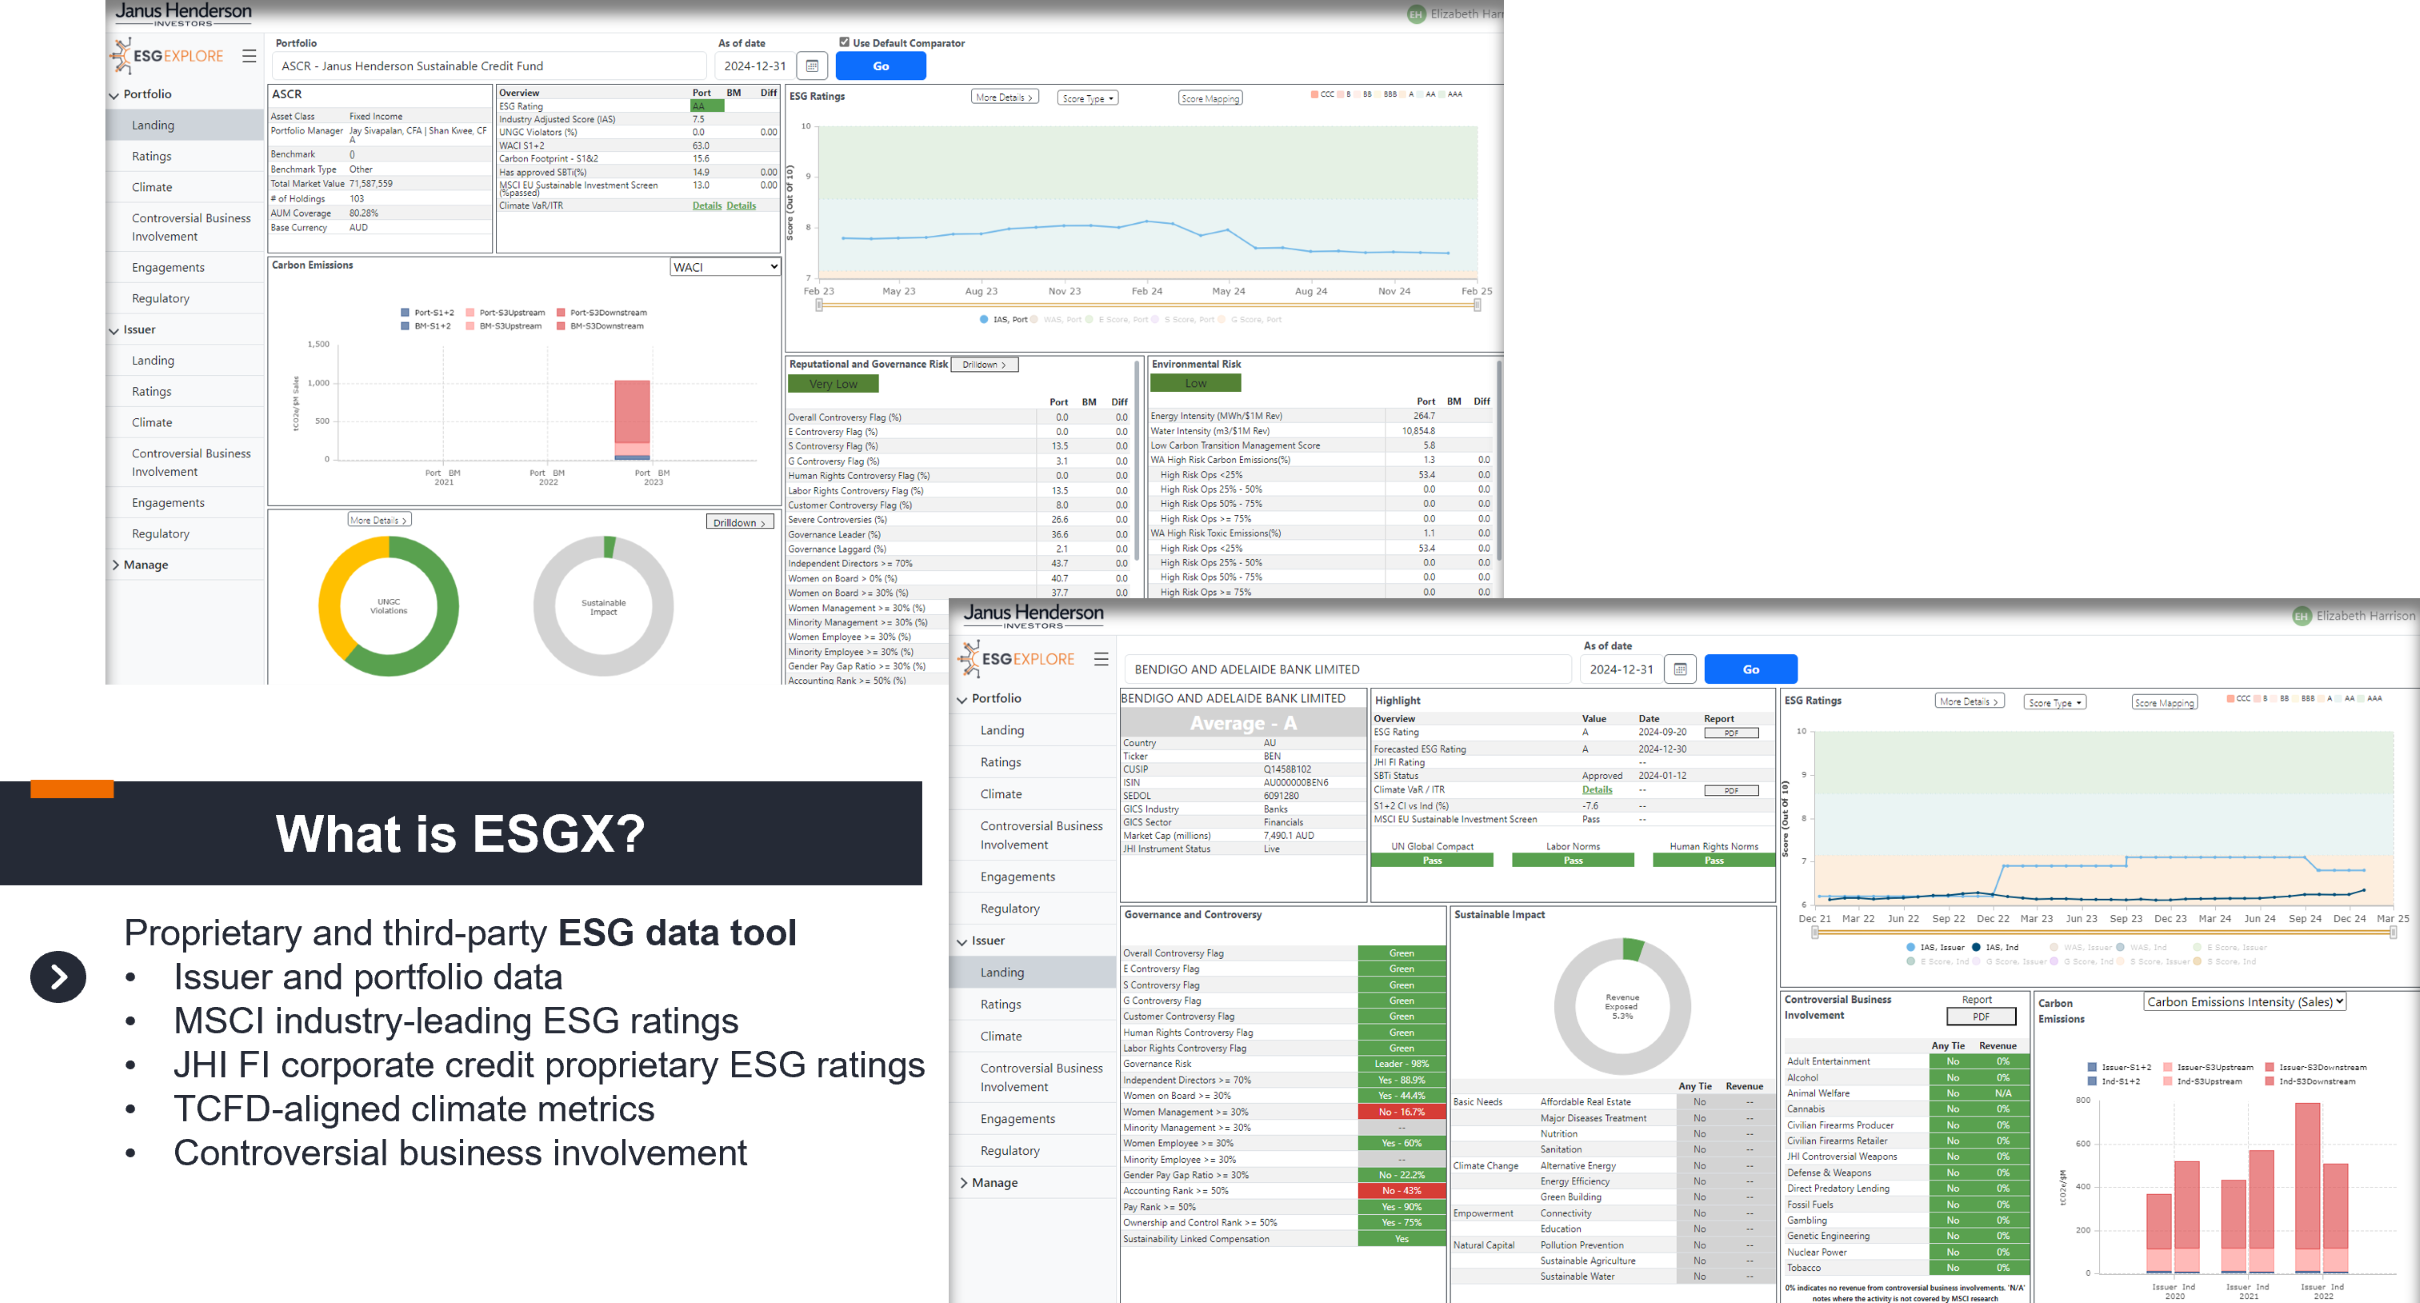
At Janus Henderson, we use MSCI as our preferred data provider. For ease of usage, we have created a proprietary data capture platform called ESG Explore which imports MSCI data. It allows the user to easily search for an issuer and obtain climate data and other ESG metrics such as controversial business involvement, controversies, MSCI risk ratings etc. Further, this same information can be calculated on a portfolio level with the total carbon emissions, weighted average carbon intensity, implied temperature rises of the asset pool and any product involvement all disclosed (where data is available). What reporting do we have available to assist asset owners?
The ESG data of our investment portfolios is then used to create our ESG reporting for the portfolios in which our clients' invest. For asset owners that need to undertake the mandatory sustainability reporting, they will need to report on scope 3 emissions from year 2. Their scope 3 emissions will comprise the scope 1 & 2 emissions of issuers within their investment portfolio. Our ESG reporting details the portfolio's carbon footprint (scope 1+2 tCO2e/USDmn invested), carbon emissions (scope 1+2 tCO2e) and weighted average carbon intensity (scope 1+2 tCO2e/USDmn sales), all reported quarterly. However, as it stands there are limitations with the availability of ESG data, with some issuers still not publishing their emissions or there is no coverage on that company by MSCI. This should improve as all companies are phased into the mandatory climate disclosure reporting. |
||||||||||||||||
|
Funds operated by this manager: Janus Henderson Australian Fixed Interest Fund , Janus Henderson Conservative Fixed Interest Fund , Janus Henderson Diversified Credit Fund , Janus Henderson Global Natural Resources Fund , Janus Henderson Tactical Income Fund , Janus Henderson Australian Fixed Interest Fund - Institutional , Janus Henderson Conservative Fixed Interest Fund - Institutional , Janus Henderson Cash Fund - Institutional , Janus Henderson Global Multi-Strategy Fund , Janus Henderson Global Sustainable Equity Fund , Janus Henderson Sustainable Credit Fund , Janus Henderson Net Zero Transition Resources Fund 1Source: ACSI, Promises, Pathways & Performance, Climate change disclosure in the ASX200, July 2024 All opinions and estimates in this information are subject to change without notice and are the views of the author at the time of publication. Janus Henderson is not under any obligation to update this information to the extent that it is or becomes out of date or incorrect. The information herein shall not in any way constitute advice or an invitation to invest. It is solely for information purposes and subject to change without notice. This information does not purport to be a comprehensive statement or description of any markets or securities referred to within. Any references to individual securities do not constitute a securities recommendation. Past performance is not indicative of future performance. The value of an investment and the income from it can fall as well as rise and you may not get back the amount originally invested. Whilst Janus Henderson believe that the information is correct at the date of publication, no warranty or representation is given to this effect and no responsibility can be accepted by Janus Henderson to any end users for any action taken on the basis of this information. |


3 Sep 2025 - The UK ETS - a policy mechanism to deliver net zero
|
The UK ETS - a policy mechanism to deliver net zero abrdn August 2025 The result of the UK Emission Trading Scheme (ETS) consultation could provide a pathway to net-zero emissions by 2050 and potentially offer a roadmap for global climate policy. What's the issue?Net zero refers to a state where the residual emissions that remain after all feasible decarbonisation has taken place are neutralised by carbon removals. The UK targets net-zero emissions by 2050 (Scotland by 2045). Yet, until now, there has been no clear policy mechanism to address these residual emissions. In July, the UK Government released the long-awaited outcome to its consultation on Integrating Greenhouse Gas Removal (GGRs) into the UK ETS. Historically, GGR credits were only usable in voluntary carbon markets as offsets. The new proposal would allow their inclusion in compliance markets, creating a policy mechanism we believe is necessary to achieve a true net-zero end-state. Each year, organisations subject to the UK ETS must purchase and submit emissions allowances through auctions, in line with their operational emissions. Under the proposed changes, GGRs would be made available through the auction mechanism, replacing normal emissions allowances on a one-for-one basis. Crucially, this will not affect the overall supply cap, which continues to decline annually and remains the primary lever through which the ETS drives decarbonisation. Intuitively, this is a sensible approach. To date, revenues from ETS auctions have flowed into the UK Treasury's general budget. Integrating GGRs would continue to boost Treasury revenue, albeit to a lesser extent, while also incentivising capital flows into carbon removal projects. While imperfect, the approach offers a dual benefit of incentivising decarbonisation and generating capital for carbon removal projects. A definitive list of the eligible removal methods hasn't been provided, but it will be guided by the forthcoming GGR British Standard Institution (BSI) standards, which currently includes:
Why are woodland and peatland not on that list?Peatland restorationNot currently on the list, as it avoids emissions rather than removes them. We think excluding peatlands is a misstep. In the UK, degraded peatlands are a significant source of emissions, accounting for 15-20% of Scotland's emissions alone. Their absence from the GGR means there's still no clear financial mechanism to help prevent these emissions. WoodlandThere's a strong indication that woodland creation will be included, but a few things must be resolved first: 1. Standard alignment: The UK Woodland Carbon Code (a voluntary scheme) already sets out standards that the GGR BSI will seek to develop. A decision is needed on whether these two frameworks will co-exist or be consolidated. 2. Policy debate: The UK Climate Change Committee recommended against inclusion, citing concerns around permanence, measurement and verification. Additionally, it highlighted the risk of market distortion and a strategic focus on engineered removals. However, several key organisations (including Department for Environment, Food and Rural Affairs) have pushed back on these concerns. What are the investment risks and opportunities?The proposed integration signals growing policy support and improves long-term market stability for GGR projects. It promotes investment in six ways. 1. Clear integration timeline - lays out the plan to legislate by 2028 and operationalise GGR integration into the ETS by the end of 2029. While subject to additional regulatory assessments and consultation, this blueprint helps reduce uncertainty for GGR developers and investors. 2. Ex-post credit issuance and long-term storage - UK ETS allowances will only be awarded after verified carbon sequestration, ensuring environmental integrity and accountability. Projects must also demonstrate a minimum carbon storage period of 200 years, with liability and fungibility measures in place. While this strengthens credibility, it diverges from some practices in the voluntary carbon market. 3. UK-based projects only - eligibility is limited to domestic removal projects, which is a positive for UK-based initiatives. Moreover, it enables offtake agreements to proceed, helping unlock investment. 4. GGR operators - improved liquidity and price discovery for GGR credits. 5. Double-whammy for carbon capture operators - companies investing in carbon capture infrastructure stand to gain on two fronts: they reduce exposure to the UK ETS carbon price (currently £48/tCO₂) and could potentially generate revenue through GGR credits. This dual incentive could significantly improve project economics. That said, we have concerns about large-scale UK assets, such as Drax's 2.6GW biomass power station, where upstream supply-chain emissions might not be adequately accounted for. Smaller operations, including Evero's Ince biomass power station at 21.5MW, raise fewer concerns. By 2029, the Ince BECCS project will seek to use the HyNet CCS infrastructure to transport and store around 250,000 tonnes of carbon beneath the Irish Sea. Several companies own biomass plants that could meet the criteria: RWE, Veolia, SSE, and E.ON. 6. Improved UK investor sentiment towards nature-based solutions - there's strong momentum behind including woodland creation in the ETS, which would create a demand floor for such projects. Woodland creation is also cheaper than engineered removals like BECCS, making the opportunity scalable and cost-effective. Government modelling suggests including woodland creation in the ETS could result in a cumulative carbon sequestration of 29-39 MtCO2e by 2050 [1] But the benefits go well beyond carbon: the same modelling estimates a Net Present Social Value (NPSV) of £27-34 billion by 2027 [2], factoring in carbon savings, job creation, and wider ecosystem services such as flood protection, improved air quality, and biodiversity gains. (NPSV is an estimate of the total societal benefits of a policy or project, such as health, environmental, and economic gains, expressed in today's money.) Our take?We've responded to the consultation and are encouraged by the findings. While we await final confirmation and further detail, we believe this marks a positive policy shift, one that broadens the range of technologies available to decarbonise the economy. It also strengthens the financial case for these projects and could spur the development of new asset classes, increasing opportunities to support decarbonisation at a lower cost. The UK's policy drive is not happening in isolation. We're seeing similar developments in the EU, California, Quebec, and Brazil [3]. We therefore expect this year's COP30 conference to emphasise the important role of nature-based carbon removals and sinks in the global journey to net zero. |
|
Funds operated by this manager: abrdn Sustainable Asian Opportunities Fund , abrdn Emerging Opportunities Fund , abrdn Sustainable International Equities Fund , abrdn International Equity Fund , abrdn Multi-Asset Real Return Fund , abrdn Multi-Asset Income Fund , abrdn Global Corporate Bond Fund (Class A) Sources include Carbonfuture's 2025 Global Guide to CDR Policy, CCarbon's WCI Emissions Outlook 2025-2026, and Climate Transparency's Implementation Check on Brazil's Carbon Market.
|

2 Sep 2025 - Australian Secure Capital Fund - Market Update
|
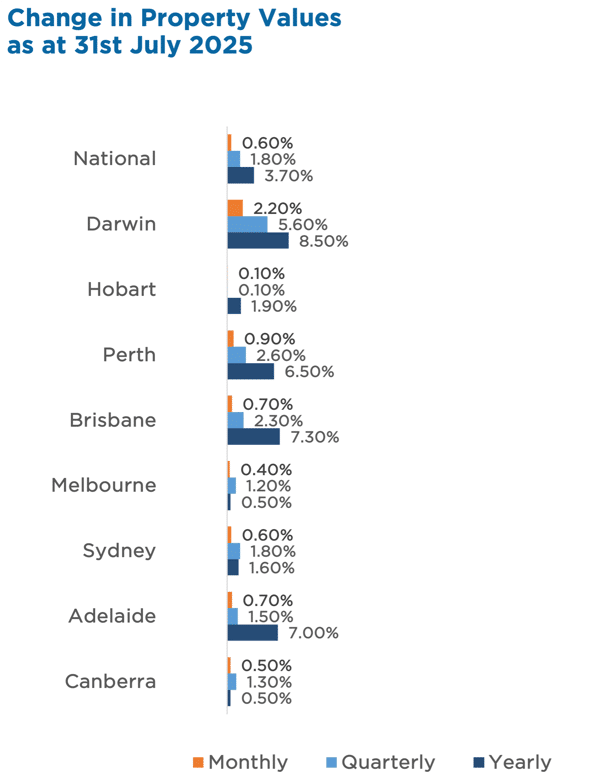
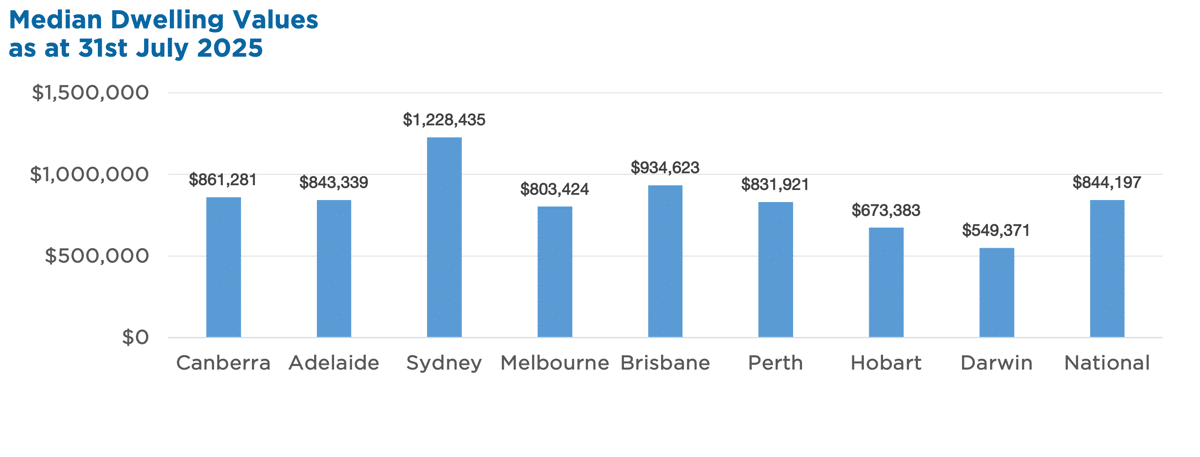
Australian Secure Capital Fund - Market Update Australian Secure Capital Fund August 2025 Australia's housing market kept its winning streak alive in July, with values rising 0.6% -- the sixth straight month of gains. Every capital city saw an uplift, led by Darwin's standout +2.2% and Perth's strong +0.9%. Tight supply (19% below average) and resilient buyer demand are keeping competition fierce, pushing auction clearance rates above the decade average. Houses are still in the lead, up 1.9% for the quarter (about $16,700), while units rose 1.4% (~$9,700) -- widening the record price gap to $223,000. Highlights:
Property Values
|
1 Sep 2025 - New Funds on Fundmonitors.com
|
New Funds on FundMonitors.com |
|
Below are some of the funds we've recently added to our database. Follow the links to view each fund's profile, where you'll have access to their offer documents, monthly reports, historical returns, performance analytics, rankings, research, platform availability, and news & insights. |
|
|
||||||||||||||||||||||
| Wilson Asset Management Leaders Fund | ||||||||||||||||||||||
|
||||||||||||||||||||||
| View Profile | ||||||||||||||||||||||
 |
||||||||||||||||||||||
| La Trobe Australian Credit Fund - 12 Month Term | ||||||||||||||||||||||
|
||||||||||||||||||||||
| View Profile | ||||||||||||||||||||||
 |
||||||||||||||||||||||
| RMC Enhanced Income Fund | ||||||||||||||||||||||
|
||||||||||||||||||||||
| View Profile | ||||||||||||||||||||||
 |
||||||||||||||||||||||
| Remara Investment Grade Credit Fund | ||||||||||||||||||||||
|
||||||||||||||||||||||
| Remara Credit Income Fund | ||||||||||||||||||||||
|
||||||||||||||||||||||
| View Profile | ||||||||||||||||||||||
| Remara Credit Opportunities Fund | ||||||||||||||||||||||
|
||||||||||||||||||||||
| View Profile | ||||||||||||||||||||||
| Remara Opportunistic Development Fund | ||||||||||||||||||||||
|
||||||||||||||||||||||
| View Profile | ||||||||||||||||||||||
|
Want to see more funds? |
||||||||||||||||||||||
|
Subscribe for full access to these funds and over 900 others |