
NEWS
3 Apr 2019 - New Funds on Fundmonitors.com
|
New Funds on Fundmonitors.com |
|
 |
||||
| THB International Micro Cap Fund | ||||
|
||||
| View Profile |
 |
||||
| Aquasia Enhanced Credit Fund | ||||
|
||||
| View Profile |
 |
||||
| Harvest Lane Asset Management Absolute Plus Fund | ||||
|
||||
| View Profile |
| Want to see more funds? |
|
Subscribe for full access to these funds and over 350 others |

3 Apr 2019 - Why banks trade off long-term survival and returns for short-term EPS

2 Apr 2019 - Performance Report: Bennelong Concentrated Australian Equities Fund
| Report Date | |
| Manager | |
| Fund Name | |
| Strategy | |
| Latest Return Date | |
| Latest Return | |
| Latest 6 Months | |
| Latest 12 Months | |
| Latest 24 Months | |
| Annualised Since Inception | |
| Inception Date | |
| FUM (millions) | |
| Fund Overview | The overriding objective of the Concentrated Australian Equities Fund is to seek investment opportunities which are under-appreciated and have the potential to deliver positive earnings, while satisfying our stringent quality criteria. Bennelong's investment process combines bottom-up fundamental analysis together with proprietary investment tools which are used to build and maintain high quality portfolios that are risk aware. The portfolio typically consists of 20-35 high-conviction stocks from the S&P/ASX 300 Index. The Fund may invest in securities listed on other exchanges where such securities relate to ASX-listed securities. Derivative instruments are mainly used to replicate underlying positions and hedge market and company specific risks. |
| Manager Comments | The Bennelong Concentrated Australian Equities Fund rose +4.32%, taking annualised performance since inception in January 2009 to +16.10% vs the ASX200's +10.50% per annum. The Fund's up-capture and down-capture ratios for performance since inception indicate that, on average, the Fund has outperformed in both rising and falling markets. In addition, the Fund's Sharpe ratio of 1.50 versus the Index's 0.93 highlights the Fund's capacity to achieve superior risk-adjusted return than the market over the long term. Bennelong noted most stocks in the portfolio reported strong numbers and generally positive outlooks as the February reporting season focused investors back on corporate profits. Top contributors included IDP Education, Corporate Travel and BWX. Detractors included Reliance Worldwide, CSL and Costa Group. Overall, Bennelong like how the portfolio is currently positioned;
|
| More Information |

2 Apr 2019 - Alzheimer's

1 Apr 2019 - Performance Report: Wheelhouse Global Equities Income Fund
| Report Date | |
| Manager | |
| Fund Name | |
| Strategy | |
| Latest Return Date | |
| Latest Return | |
| Latest 6 Months | |
| Latest 12 Months | |
| Latest 24 Months | |
| Annualised Since Inception | |
| Inception Date | |
| FUM (millions) | |
| Fund Overview | To pursue this objective, the Investment Manager is responsible for actively managing, monitoring and tailoring the integration of derivative contracts alongside the Morningstar Portfolio, while taking into account changing market and stock specific conditions. The Investment Manager is responsible for maximising the structural benefits of short option positions (lowered Volatility, improved capital preservation, higher income generation), whilst mitigating, minimising and monitoring the structural negatives (variable market exposure, option expiries, collateral management and asymmetric return profiles). In addition, long derivatives positions are also used to enhance the capital preservation characteristics of the Fund in more extreme market movements. As a consequence of the integration of Derivatives, returns of the strategy, intra-cycle, are expected to vary from the underlying Morningstar Portfolio due to these characteristics. For example in weak markets, or in extended sideways markets, the Fund is expected to outperform relative to the Morningstar Portfolio. Conversely in strong positive markets the Fund is expected to underperform. |
| Manager Comments | Top contributors included Jones Lang Lasalle, Intel Corp, Zimmer Biomet, ServiceNow Inc and KLA-Tencor. Detractors included Amazon, Essilorluxottica, Kellogg, Gilead Sciences and Western Union. The Fund is designed to deliver equity returns with higher income generation and active downside protection. The strategy's high income generation and active tail risk program are designed to lower risk and deliver equity returns with a smoother, more retiree-friendly return profile. As a result, Wheelhouse intend for returns to add relative value in weak and low-growth markets and to drag in more positive markets. |
| More Information |

1 Apr 2019 - Performance Report: Touchstone Index Unaware Fund
| Report Date | |
| Manager | |
| Fund Name | |
| Strategy | |
| Latest Return Date | |
| Latest Return | |
| Latest 6 Months | |
| Latest 12 Months | |
| Latest 24 Months | |
| Annualised Since Inception | |
| Inception Date | |
| FUM (millions) | |
| Fund Overview | The portfolio is constructed using Touchstone's Quality-At-a-Reasonable-Price ('QARP') investment process. QARP is a fundamental bottom-up process, however, it also incorporates a top-down risk management framework designed to successfully manage the portfolio during varying market conditions and economic cycles. The Touchstone Fund is concentrated, typically holding between 15-20 stocks. No individual stock will ever make up more than 10% of the portfolio at any one time. The Investment Manager may temporarily exceed the exposure limits of the Fund occasionally, particularly during periods of market volatility, to allow for holdings in excess of this 10% limit where the increase in value of the underlying security is due to market movement. The Fund may also hold between 0-50% of the portfolio in cash. The Fund has a high level of associated risk, therefore, the minimum suggested investment time-frame is 5 years. |
| Manager Comments | As at the end of February, the Fund held 21 stocks with a median position size of 4.4%. The portfolio's holdings had an average forward year price/earnings of 15.9, forward year EPS growth of 4.9%, forward year tangible ROE of 28.5% and forward year dividend yield of 4.5%. The Fund's cash weighting increased to 4.8% from 3.7% at the end of January. The Fund primarily seeks to select stocks from the ASX300 Index, typically holding between 10-30 stocks. The Fund seeks to invest in reasonably priced, good quality companies with a significant share of expected returns coming from sustainable dividends. |
| More Information |

1 Apr 2019 - Performance Report: 4D Global Infrastructure Fund
| Report Date | |
| Manager | |
| Fund Name | |
| Strategy | |
| Latest Return Date | |
| Latest Return | |
| Latest 6 Months | |
| Latest 12 Months | |
| Latest 24 Months | |
| Annualised Since Inception | |
| Inception Date | |
| FUM (millions) | |
| Fund Overview | The fund will be managed as a single portfolio of listed global infrastructure securities including regulated utilities in gas, electricity and water, transport infrastructure such as airports, ports, road and rail as well as communication assets such as the towers and satellite sectors. The portfolio is intended to have exposure to both developed and emerging market opportunities, with country risk assessed internally before any investment is considered. The maximum absolute position of an individual stock is 7% of the fund. |
| Manager Comments | The strongest portfolio performer was Chinese gas distributor China Resources Gas Group, up +11.1%. The weakest performer was global port operator DP World, down -10.1%. 4D believe the fall in DP World was due to increasing investor concern of a slowing global economy, however, their view is that the recent sell off has been overdone and is not supported by their solid diversified earnings base. Despite a slowing global macro environment, the portfolio remains in positive territory and supportive of 4D's overweight positioning to user pay assets which, they note, have a direct correlation to macro. However, 4D remain cautious of ongoing geo-political issues and have positioned accordingly. |
| More Information |

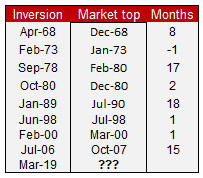
29 Mar 2019 - Hedge Clippings | Yield inversion and the "R" word
|
||||
|
If you'd like to receive Hedge Clippings direct to your inbox each Friday
|


29 Mar 2019 - Performance Report: Quay Global Real Estate Fund
| Report Date | |
| Manager | |
| Fund Name | |
| Strategy | |
| Latest Return Date | |
| Latest Return | |
| Latest 6 Months | |
| Latest 12 Months | |
| Latest 24 Months | |
| Annualised Since Inception | |
| Inception Date | |
| FUM (millions) | |
| Fund Overview | The Fund will invest in a number of global listed real estate companies, groups or funds. The investment strategy is to make investments in real estate securities at a price that will deliver a real, after inflation, total return of 5% per annum (before costs and fees), inclusive of distributions over a longer-term period. The Investment Strategy is indifferent to the constraints of any index benchmarks and is relatively concentrated in its number of investments. The Fund is expected to own between 20 and 40 securities, and from time to time up to 20% of the portfolio maybe invested in cash. The Fund is $A un-hedged. |
| Manager Comments | Top contributors in February included Safestore, Sun Communities and Coresite. Detractors included LEG Immobilien, Scentre Group and Ventas. Quay noted so far this year they haven't received any earnings shocks from any of their investees, which they believe is due to their strategy to invest in simple, easy to understand rent-based real estate opportunities (the strategy avoids deeply cyclical developers, fund managers, infrastructure, etc.). The portfolio remains largely unchanged as Quay continue to back their long run themes of ageing demographics, home affordability, student accommodation and best in class retail. They noted they liquidated a small position in Canadian housing (Boardwalk) and re-invested the proceeds in some of the Fund's investees that have underperformed recently (Scentre, LEG and Ventas), reducing the number of stocks to 25 across the portfolio. |
| More Information |

29 Mar 2019 - Performance Report: Insync Global Capital Aware Fund
| Report Date | |
| Manager | |
| Fund Name | |
| Strategy | |
| Latest Return Date | |
| Latest Return | |
| Latest 6 Months | |
| Latest 12 Months | |
| Latest 24 Months | |
| Annualised Since Inception | |
| Inception Date | |
| FUM (millions) | |
| Fund Overview | Insync employs four simple screens to narrow the universe of over 40,000 listed companies globally to a focus group of high quality companies that it believes have the potential to consistently grow their profits and dividends. These screens are size of the company, balance sheet performance, valuation and dividend quality. Companies that pass this due diligence process are then valued using dividend discount models, free cash flow yield and proprietary implied growth and expected return models. The end result is a high conviction portfolio of typically 15-30 stocks. The principal investments will be in shares of companies listed on international stock exchanges (including the US, Europe and Asia). The Fund may also hold cash, derivatives (for example futures, options and swaps), currency contracts, American Depository Receipts and Global Depository Receipts. The Fund may also invest in various types of international pooled investment vehicles. At times, Insync may consider holding higher levels of cash if valuations are full and it is difficult to find attractive investment opportunities. When Insync believes markets to be overvalued, it may hold part of its resources in cash, or use derivatives as a way of reducing its equity exposure. Insync may use options, futures and other derivatives to reduce risk or gain exposure to underlying physical investments. The Fund may purchase put options on market indices or specific stocks to hedge against losses caused by declines in the prices of stocks in its portfolio. |
| Manager Comments | The Insync Global Capital Aware Fund rose +5.29% in February after fees and protection, slightly outperforming AFM's Global Equity benchmark and taking annualised performance since inception in October 2009 to +9.93%. The Fund's largest drawdown since inception has been -10.98% versus the benchmark's -13.60% over the same period which, in conjunction with the Fund's down-capture ratio of 58.61%, highlights the benefit of the Fund's downside protection. Before the cost of protection, the Fund returned +5.38% in February and has delivered +12.61% p.a. since inception (see the Insync Global Quality Equity Fund's profile). Insync noted strong contributions from stock selection were marginally offset by a decline in the value of the index 'puts' due to a continued sharp market recovery and further falls in volatility. Positive highlights include Intuit, Visa, Estee Lauder, Accenture and Heineken (read Insync's latest Insights article on Heineken here). Detractors included Facebook, Tencent Holdings, Booking Holdings and Wirecard AG. No currency hedging continues across both of Insync's funds as Insync consider the main risks to the Australian dollar to be on the downside. |
| More Information |