NEWS

10 Mar 2022 - How to Handle the Current Falling Market
|
How to Handle the Current Falling Market Wealthlander Active Investment Specialist February 2022
Some investors have asked us how to handle a falling market as many of their investments are losing a lot of money. Here is a summary list of our suggestions about what can be done to stop the unnecessary pain, and adapt portfolios to the new environment. 1. Recognise the Game has Changed Inflation hurts the poor and the middle class who make up the majority of US voters. A significant majority of US voters don't own much in the way of anything that benefits from price increases and haven't benefitted meaningfully from historic asset price inflation. Hence a heavily politicised FED may be forced politically to prioritise fighting inflation ahead of boosting investment markets. They do this by reducing stimulus and raising interest rates. Unfortunately for investors, fighting inflation through reducing balance sheet expansion and raising interest rates only works by crushing demand first. This means economic demand and demand for equities need to get crushed as a necessary precondition to central banks effectively fighting inflation, if they attempt to do so. We might think of this as a policy mistake or a central bank choice, as other measures of fighting inflation (such as addressing supply and labour force issues) are better than anything central banks can do - but it is what it is and comes attendant potentially dramatic effects on mainstream markets. Effectively, one needs to acknowledge the investment cycle, as we highlighted in our article in early January "Four Ways to Massively Improve Performance in 2022: https://www.livewiremarkets.com/wires/four-ways-to-massively-improve-performance-in-2022 By recognising that the game has changed, investors can pivot their portfolio approach from what has worked in a bull market driven by disinflation and interest rates moving to 0, to what works better in a bear market caused by inflation, higher interest rates and reduced stimulus and demand (as massive stimulus packages are withdrawn and inflation bites into real wages growth). The first thing that astute investors can and are doing is reduce the risk of losing money by selling or reducing assets that don't work outside a bull market, and which are at risk of building larger losses. Importantly, it is not losing small amounts but losing large losses in bear markets that destroy investors' long term geometric returns. By way of illustration of this, if you lose 33% you need a massive 50% gain to get back to even; lose 50% and you need 100% gain just to stay still. Furthermore, the journey of the investor is far from pleasant when you are in large losing territory much of the time. Far better not to lose the 33% or 50% in the first place as there is no good cure, but only prevention. 2. Take Advantage of Volatility The assets which are better suited to rising inflation and interest rates include numerous alternatives. These alternatives include skill dependent rather than market dependent managers, market neutral and long short funds, volatility funds, insurance strategies, some CTAs, commodities such as oil and gold, and small subsets of the equity and property market such as shorter duration equities including resources, farmland and water. You probably don't own much of these currently and hence aren't protecting capital from losses as well as you could be in early 2022. The asset classes don't have the marketing and media budgets of the mainstream approaches so you probably don't know as much about them. Importantly, these assets are less likely to lose large amounts over an inflationary period compared with the financial assets mentioned previously. Not losing much in tough periods is the name of the game for long term returns and compounding, as well as the more risk averse. By potentially making money or not losing as much, the assets and strategies mentioned are far better suited to protecting capital and enabling long term compounding of your wealth, and particularly so compared with financial assets which are being meaningfully devalued. Furthermore, they offer a way of crystallising and cashing in strong equity and property gains of the last few years permanently, while still offering growth potential in the future. 3. Take Advantage of Volatility 4. Emphasize Better Value Niche Assets In summaryThere is much you can do not to be a deer in the headlights. Inflationary periods haven't been seen for a long time and most investors need to learn how to adapt to this different environment while it lasts. The ostrich approach with a portfolio suited to an entirely different economic regime doesn't work well when inflation is here. If you're losing large money, it's probably because your portfolio is poorly diversified and extrapolating history that is no longer with us, rather than being adapted to the times. It is far more prudent in current circumstances to adapt to the new investment environment, and buy a broader mix of assets that provide diversification and resilience. This includes a wide range of alternatives, managers that can take advantage of volatility, and better value niche assets. True diversification is the only free lunch in town right now and there is a delicious smorgasbord on offer to choose from. Venison and ostrich is missing from the menu. Funds operated by this manager: WealthLander Diversified Alternative Fund DISCLAIMER: This Article is for informational purposes only. It does not constitute investment or financial advice nor an offer to acquire a financial product. Before acting on any information contained in this Article, each person should obtain independent taxation, financial and legal advice relating to this information and consider it carefully before making any decision or recommendation. To the extent this Article does contain advice, in preparing any such advice in this Article, we have not taken into account any particular person's objectives, financial situation or needs. Furthermore, you may not rely on this message as advice unless subsequently confirmed by letter signed by an authorised representative of WealthLander Pty Ltd (WealthLander). You should, before acting on this information, consider the appropriateness of this information having regard to your personal objectives, financial situation or needs. We recommend you obtain financial advice specific to your situation before making any financial investment or insurance decision. WealthLander makes no representation or warranty as to whether the information is accurate, complete or up-to-date. To the extent permitted by law, we accept no responsibility for any misstatements or omissions, negligent or otherwise, and do not guarantee the integrity of the Article (or any attachments). All opinions and views expressed constitute judgment as of the date of writing and may change at any time without notice and without obligation. WealthLander Pty Ltd is a Corporate Authorised Representative (CAR Number 001285158) of Boutique Capital Pty Ltd ACN 621 697 621 AFSL No.508011. |

9 Mar 2022 - The question is, when should you invest?
|
The question is, when should you invest? Insync Fund Managers February 2022 Why we don't try to predict macro-market changes. We don't need to, no investor does. It is well established that the total returns of a stock follow the earnings growth of a business in the long term. Companies that can sustainably grow their earnings at a high rate over the long term are called compounders. Investing in a portfolio of compounders is one of the best ways to generate wealth for longer-term oriented investors that beat market averages. A major benefit of compounders is that market timing is rarely an issue, hence risk is also reduced. Our industry spends an inordinate amount of time trying to predict or forecast the future of markets. Sophisticated soothsaying by in-large. The probability of getting this right on a consistent basis is very low. Many espouse otherwise but a check of their historical records on predictions are quite revealing. Consider this:
What about the worst 20? It is also valid that avoiding the worst 20 days would have boosted your return beyond the fully invested 7.5% annualised return. The best and worst return periods show that extreme events have a large bearing on investor returns. Based on volatility around extreme events (and their mostly unpredictable appearances), it is impossible to predict the worst and best days. Indexing cannot filter in/out the extremes. If only those sophisticated 'crystal balls' in the hands of commentators and fund managers actually worked! Insync's "active" basket of 28 compounder stocks, carefully constructed to control the risk, delivers outperformance over passive benchmarks, over both full and multiple investment cycles, and does so without having to predict extreme events. Fastest decline in history. The Covid-19 pandemic clearly demonstrates the folly of an approach based on prediction. It created the fastest stock market decline in history catching out investors who believed prediction works. Let's say however, you were right and got out in time. Next and without warning, the fastest recovery in history then occurred. Unless you were in the market you missed out in a big way.
Predictions require constant and correct timing decisions. Stay in or out? If out, when? Then to where? And for how long? Thus, multiple questions need to be answered just for each event. Now, repeat over the life of your investment hundreds of times. No person or organisation has successfully got these answers sustainably right to produce great enduring outcomes. Market timing strategies also cannot benefit from the compounders. This is because timing tends to interrupt the powerful process of the conversion of earnings into price appreciation. Insync's focus on investing in compounders means we don't need to concern ourselves with the low hit-rate strategy of market timing stocks we hold. This is just one way we lower risk to our investors yet retain above average returns over time that endure. Examples of compounders
Funds operated by this manager: Insync Global Capital Aware Fund, Insync Global Quality Equity Fund |

8 Mar 2022 - Manager Insights | Cyan Investment Management
|
|
||
|
Chris Gosselin, CEO of FundMonitors.com, speaks with Dean Fergie, Director & Portfolio Manager at Cyan Investment Management. The Cyan C3G Fund has a track record of 7 years and 6 months and has outperformed the ASX Small Ordinaries Total Return Index since inception in August 2014, providing investors with an annualised return of 13.69% compared with the index's return of 8.08% over the same period. The fund has achieved a down-capture ratio since inception of 57.19%, indicating that, on average, the fund has outperformed in the market's negative months.
|
8 Mar 2022 - Aligning Interests: (no freeloading on my tab!)
|
Aligning Interests: (no freeloading on my tab!) Colins St Asset Management February 2022 |
|
Fat salaries. Big bonuses. Plummeting share price. Sound familiar?That an article discussing the benefits of aligned interests should even need to be written deeply concerns and somewhat surprises me. Nevertheless, it's clear from our experiences that there are plenty of companies where the interests of the executives and the interests of the shareholders are in direct and lopsided conflict. It boggles my mind that investors would put up with such situations, but it seems that many people out there are either unconcerned that the managers and directors looking after their money don't care about their goals or are simply too busy speculating to notice. So, though it pains me to my value investing roots to prepare this article, here are our thoughts on where investor interests and attention should be (in our humble opinion). "Show me the incentive, and I will show you the outcome." - Charlie Munger, Berkshire Hathaway There are many factors we consider when looking to invest in a company. No doubt, the basic matters such as balance sheet strength, return on equity, and competent management rank highly, but even when all of those factors are in place, a conflict of interest between the incentives for the management team and the interests of shareholders can see an otherwise attractive investment opportunity devolve into an expensive 'learning experience'. It should go without saying that a management team and investors should make all possible effort to ensure that their interests are aligned, but shockingly it is far less common than one would expect. Where investors are concerned with positive long-term outcomes, strong balance sheets, return on assets, return on invested capital, and primarily an increasing share price, many managements incentive schemes (both short term and long term) stunningly disregard some (or all of those factors) in lieu of more 'inventive' measures of success. We've seen management teams align their incentive schemes to revenue, or market cap growth, we've even seen some propose that the management team be rewarded for product growth. In each of those circumstances, we've seen time and again, management teams sacrifice balance sheet strength (via leverage), long term share prices (with dilutionary capital raisings), and margins (in search of wider and less profitable products). None of that behaviour suits shareholders, but all too often, the powers that be, who create long and short-term incentives get lost in the excitement of a good story or an exciting 'opportunity' and forget that the only role a management team should be playing is that of enriching the company's shareholders. Now it's important to note that even a perfect alignment of interests is not a guarantee of success. There have been plenty of companies with the best of intentions that have failed. However, we would suggest that over the long term, misaligned interests are a guarantee of failure. HOW TO ALIGN INTERESTS:There is no one-size-fits-all approach, but broadly speaking there are a few basic things a board should look to do.
2. An improvement on our first point is to align management interests with shareholders by insisting that they become shareholders.
3. Once we've seen management align their interests to both the upside and the downside of the company, we also like to see the directors consistently increase their stake in the business.
If we can find a competent team that is prepared to support the company and align their interests with shareholders, it is one of the best indicators we can find for positive outcomes. A great example of this in practice is National Tyre and Wheel (NTD.ASX). National Tyre and Wheel is a Queensland based business that, through its 28 different distribution centres spread over 3 countries, distributes tyres across a range of industries and sectors as diverse as emergency services, agriculture, off-road adventure driving and industrial vehicles (such as forklifts). The Board and Senior Management have been working together for over 30 years, well before the company was listed on the ASX. Key things that I like about the structure and alignment of interests within National Tyre and Wheel include:
Some other questions investors should be asking: There are no perfect solutions, but there are some simple steps we can take, and some indications we can look out for.
If the company is consolidating, incentives should reflect that. If the company is growing, then the incentives would be reflective of that.
It's worth offering highly attractive incentives to entice and retain quality staff. At the same time, it's important that those benefits are earned.
If the company's employees and Board are confident in the outlook of the business, receiving part of their salary in equity is enticing.
A toxic culture may achieve seemingly good outcomes in the short term but could have catastrophic consequences in the long term. Again, there is no guaranteed method for ensuring success, but knowing that the management team are working towards the same goals that we investors seek, and that a loss to investors will be equally felt by the management team is as good an indicator of the quality and prospects of a business as any we've been able to identify. How we align our interests. At Collins St Value Fund we take these lessons to heart. We expect the directors of the companies we invest in to align their interests with ours, and we expect nothing less from the investors who have entrusted us to look after their capital. As such the team have meaningfully invested in the fund and have done so on the same terms as all our investors. Additionally, the fund only receives a fee when our investors profit (focussing our attention on both genuinely protecting the downside and maximising the upside) - there are no fixed management fees skimmed off the top of investors capital as we believe, that in the Australian equities context, they incentivise little more than asset gathering, rent-seeking, index hugging and, ultimately, mediocrity. Author: Michael Goldberg, Managing Director and Portfolio Manager
|

8 Mar 2022 - Webinar | Premium China Funds Management - Asian Fixed Income Webinar
|
Webinar | Premium China Funds Management - Asian Fixed Income The travails of certain Chinese property developers continue to impact Asian corporate bonds. Jonathan Wu has an update on how we are traversing this landscape. Speaker: Jonathan Wu, Premium's Head of Distribution and Operations & Chief Investment Specialist
|

7 Mar 2022 - Manager Insights | Laureola Advisors
|
|
||
|
Damen Purcell, COO of Australian Fund Monitors, speaks with John Swallow, Director at Laureola Advisors. The Laureola Australian Feeder Fund has a track record of 8 years and 10 months and has consistently outperformed the Bloomberg AusBond Composite 0+ Yr Index since inception in May 2013, providing investors with a return of 14.96%, compared with the index's return of 3.55% over the same time period.The fund has provided positive monthly returns 97% of the time in rising markets, and 97% of the time when the market was negative, contributing to an up capture ratio since inception of 160% and a down capture ratio of -249%.
|

7 Mar 2022 - Norsk Hydro: In discussion with Pål Kildemo
|
Norsk Hydro: In discussion with Pål Kildemo Antipodes Partners Limited February 2022 In this episode on the Good Value podcast (recorded Monday 21 February 2022), Alison Savas is joined by the Executive Vice President and CFO of Norsk Hydro, Pål Kildemo. Norsk Hydro is a long-term holding in Antipodes' global portfolios, including the ASX-listed Antipodes Global Shares (Quoted Managed Fund) active-ETF (ASX: AGX1). Not only is the Oslo-listed company one of the largest aluminium producers in the world, it also has one of the lowest carbon footprints. Alison and Pål discuss Norsk's low-carbon, low-cost production, the opportunity for a green aluminium premium, and the structural trends impacting the aluminium market. |
|
Funds operated by this manager: Antipodes Asia Fund, Antipodes Global Fund, Antipodes Global Fund - Long Only (Class I) |

7 Mar 2022 - Is the (Liquidity) Party Over?
|
Is the (Liquidity) Party Over? Longwave Capital Partners February 2022 Inflation, interest rates and liquidity. The equity market is finally taking notice that all three of these issues are very real. The most speculative stocks were the biggest beneficiaries of recent liquidity abundance and are now most at risk should liquidity retreat - which is exactly what bond markets and most central banks are confirming. In short, the Fed has signaled the liquidity party in SPACs, tech, crypto, concept stocks and promotions is now over. Please go home. Investment results are best considered over a full cycle, and in the case of monetary policy and liquidity we are now seeing what the other half of that looks like. In the past two years we have often been asked if our definition of quality costs us the ability to participate in innovation. Putting aside how early you need to be in the innovation cycle to capture outstanding returns we question whether much of what passed as innovation by companies and alpha by investors was anything more than just a liquidity bubble. I guess we will only know for sure once this cycle completes, but it does make a mockery of the popular growth stock returns narrative, which may be explained almost completely by sentiment and not at all by superior business performance. Generating Positive Returns in a Deflating BubbleMany investors draw parallels between this market to the tech bubble and aftermath in the early 2000s. We think this a very instructive analogy, but a more recent period may also hold lessons for small cap investors navigating the next few years. For six long years, from December 2010 to December 2016, the S&P/ASX Small Ordinaries index delivered investors zero total return as the resources and mining services bubble - which had grown to a huge weight in the index - crested and painfully deflated. Because there was such high divergence in returns before and then during this deflation period, many active small cap managers were still able to generate reasonable absolute returns (5-10% or more per annum) from 2010 to 2016. The trick of course was to avoid getting caught up in the deflation of market values for those stocks that had run up hard in the commodity super cycle (after the peak the small resources index declined by 17.5% per annum from Dec 2010 to Dec 2016) and invest in previously unpopular, overlooked and under-valued companies (the small industrials index increased by 8% per annum over the same period). Today, dispersion in the small cap market is similarly extreme. This means active managers have many compelling investment opportunities away from stocks exposed to liquidity withdrawal and excessive valuation. Microcap stocks are probably the most at risk given their high prices, lack of profitability and sensitivity to liquidity conditions. Microcaps in January 2022 remind us of small resources in December 2010. For many months we have discussed what these opportunities look like - and for a sample of names readers can always refer to the top 10 fund holdings - but to reiterate what we believe will allow investors continuing to generate returns worthy of staying invested in equities, below is a list of attributes to consider:
At the end of January, our portfolio is composed of companies that have in aggregate grown EPS at 15% per annum for the past three years but have been de-rated (PE multiples have declined) as the market was more interested in paying up for "liquidity party" stocks. Our current portfolio look-through return on equity is almost 20% and after price declines in January the P/E multiple is now around 13x. Expressed as a pre-tax earnings yield, our portfolio is offering almost 9% more than the Australian 10yr government bond - a metric worth watching as bond yields rise. Innovation is not over. We will always be on the lookout for genuinely innovative companies that solve customer problems in novel ways and have an economic competitive advantage that captures this value for shareholders. Hopefully the current turmoil and the upcoming reporting season provides more of these opportunities for the fund. February 1st, 2022 marks the first three years of the Longwave Australian Small Companies fund performance. Few strategies can outperform in every short-term market environment. Even fewer can do so applying a long term, low turnover investment strategy where the goal is not to keep churning the portfolio into the stocks du jour. We are often asked "in what market environment would your investment approach struggle?". Before COVID, we had said a period like the dot-com bubble in the late 1990s was one in which we would likely struggle to outperform, as fundamentals and valuation took a back seat to sentiment and liquidity. Given the lessons of this period were recent and accessible to investors we thought it unlikely to recur anytime soon. We were wrong. The period from April 2020 to November 2021 ended up being exactly that type of market. So more than 50% of the first three years of our fund performance has been in a period quite hostile to our investment approach. We managed to tread water rather than sink in relative performance terms, holding the portfolio in good stead as we likely move into a market better suited to our fundamental quality and valuation based approach. Written By David Wanis, Founding Partner & CIO and Portfolio Manager |
|
Funds operated by this manager: |

7 Mar 2022 - Why it's time to capitalise on the carnage in tech stocks
|
Why it's time to capitalise on the carnage in tech stocks Montgomery Investment Management February 2022 The current equity correction has taken a lot of the froth out of the market. But caught up in the carnage have been a number of high quality companies with years of growth ahead. Which is why I think this could be a very good time for investors to take a look at some of these businesses, including Pro Medicus, Megaport and REA Group. January has seen an acceleration of selling that began as a rotation out of high-flying tech stocks in late November and December (the Nasdaq peaked on November 19, 2021). The carnage for technology stocks deteriorated further when the US Federal Reserve's last policy meeting minutes revealed a more hawkish attitude towards rates and bond purchases than many expected. Simply put, it now appears central banks are accelerating their normalisation of both monetary policy and balance sheets. As one broker eloquently observed, "it follows that equity market valuations...also normalise." According to Goldman Sachs prime broking, during the last two sessions of December 2021 and the first two sessions of January 2022, technology selling, in dollar terms, reached its highest level in more than a decade. Inspired by central bank 'Wealth Effect' ideology, negative real yields on cash have been in place for the bulk of the last 11 years giving investors ample opportunity to be frog marched out of cash and into almost anything else. As we have written about frequently over the last five years, booms and bubbles have hitherto formed in everything from property and bonds, to coins, stamps and low digit number plates, to NFTs, cryptocurrencies and anything else related to the blockchain and the metaverse. In the stock market, technology and healthcare sector valuations, particularly in the US (in turn thanks to private equity's game of pass-the-parcel) became the most stretched at the beginning of the year. And US equities, perhaps consequently, had been expensive by most measures. As bond yields now move higher, the short-term ownership of high-flying tech names - particularly long-duration stocks with earnings pushed well out into the future - becomes more difficult to justify. Not all technology companies are created equalI have often written, investing in shares involves the ever-present risk of setbacks, and quality is the investor's best friend. An examination of how the current tech sell-off has played out reveals some merit in the idea that not all technology companies are created equal. Last year I pointed out companies including Apple, Amazon, Microsoft, Google and Facebook generated levels of profitability previously unfathomable. As these companies become larger, their profitability also increases. As their equity grows so too does their return on equity. Think of a bank account with $1 million earnings interest of 1% per annum, and as the equity in the bank account grows to $1 billion, the interest rate earned also rises to 40% per year. Such business economics weren't even contemplated in business schools just a decade ago. These superior business economics perhaps explain the discriminating selling of tech names in the first month of 2022. Perhaps the most useful observation however is about investor behavior itself. As commonly defines these pullbacks, investors have simply shortened their time horizons. Long-term investment plans have been abandoned and in their place is a preoccupation with what will happen to prices tomorrow. Interest in long-term company fundamentals is exchanged for short-term fears about interest rates. The current equity correction will cull much of the leverage and froth built up in recent years. What it won't do is change the course of growth for many high-quality companies. Setbacks are a normal and healthy part of investing. Indeed, the only unusual thing is their absence. The market has been swinging manic-depressively for centuries. From wild bouts of optimism - when only the most enthusiastic appraisals will be entertained, to periods of deep depression - when sellers are willing to sell even the best companies for cents in the dollar, investors can count on one thing: opportunity. Now is therefore the time to rebalance portfolios, taking advantage of the lower prices and PE deratings that have been experienced by some of the highest quality names in the market (see Table 1). Table 1: Relative 'De-rates' since 4 January 2022 And keep in mind, none of the assets now falling are held in large volume by systemically important financial institutions. Banks don't own cryptocurrencies or NFTs, or the promise of smart contracts to reduce agency costs and remove the middleman. They don't own the profitless prosperity stocks either. In other words, this sell-off will not lead to a financial crisis. This is therefore a plain vanilla correction that will see investors who have taken on too much risk in the quest for returns suffer more than those who have been disciplined about quality and value. And remember my call that 2022 should be a good one for investors? There are 11 months to go with plenty of potential opportunities now available. Written By Roger Montgomery Funds operated by this manager: Montgomery (Private) Fund, Montgomery Small Companies Fund, The Montgomery Fund |

4 Mar 2022 - When it's good to be bad
|
When it's good to be bad Ophir Asset Management February 2022 |
|
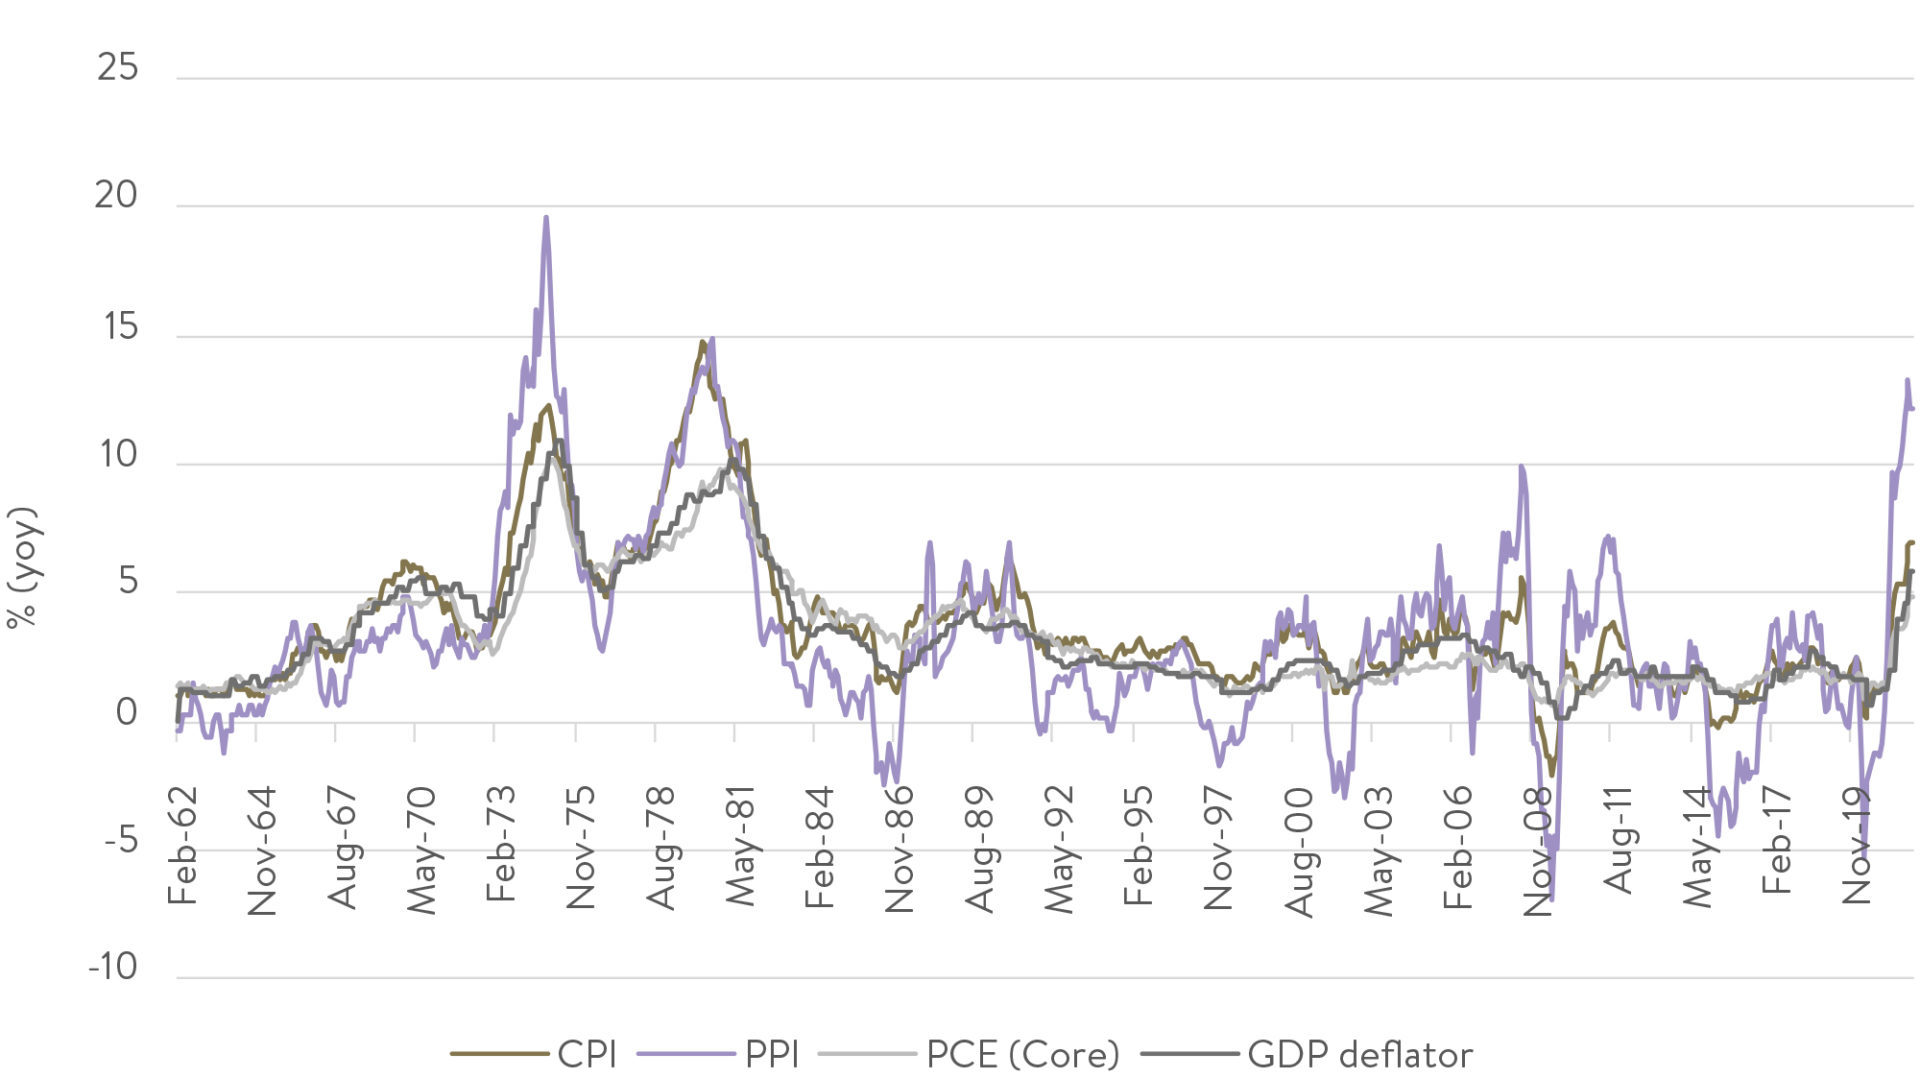
Inflation 'Persistently transitory'? You'd have to be buried under a rock of late, or thoroughly disinterested in the news of the day, to not know that inflation is back. And back in a big way! Many young people today in developed economies haven't known what an inflation problem is. They've only known low interest rates that have been great for leveraging into investment properties. But COVID-19 has changed all that. Below we show various different inflation measures in the US, the world's still-largest economy. CPI, or Consumer Price Inflation, is the one heard most by investors and it is currently at 7%, well above the US Federal Reserve's 2% target. US inflation (yoy)
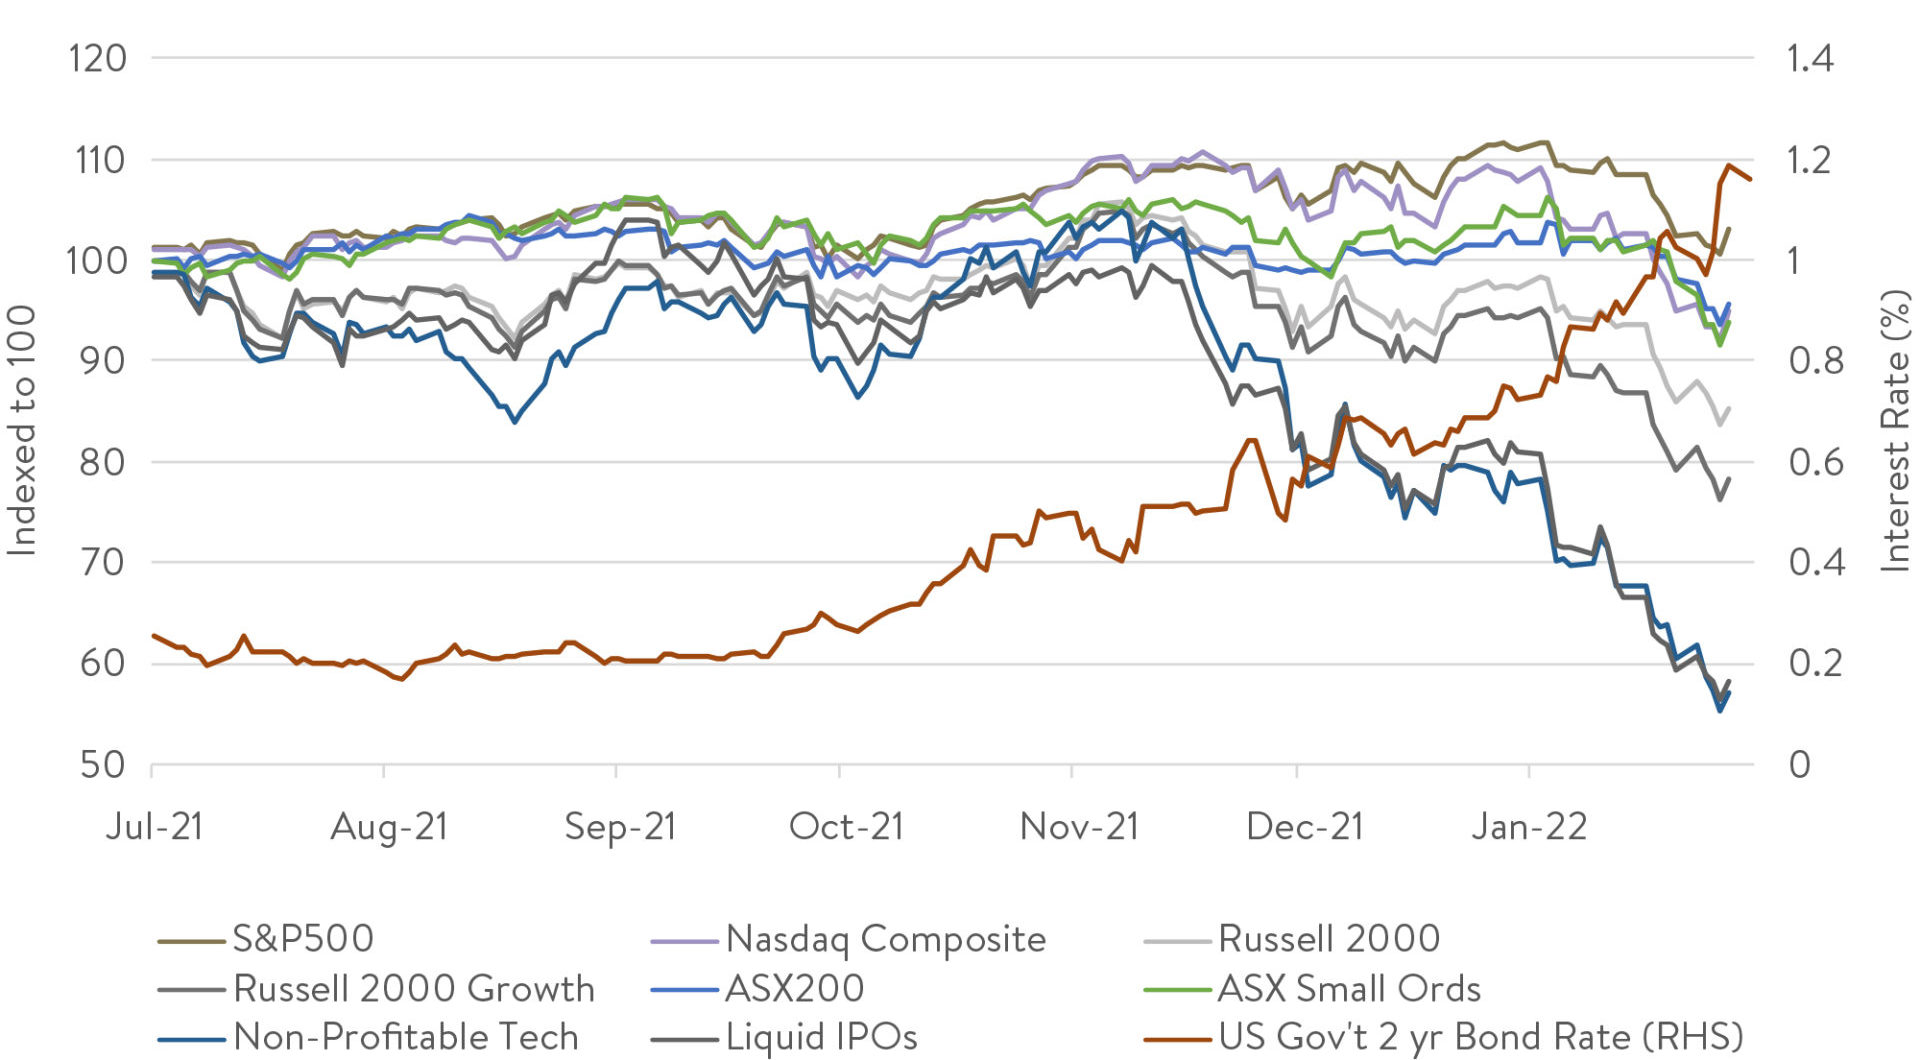
Source: Ophir, Factset Why is this? Well, looking at the components that make up CPI, it is clear it's high mainly because (government boosted) demand for goods by locked up households during COVID-19 has greatly outstripped supply, pushing up their prices. CPI is likely to wane in the second half of 2022 as households spend their government cheques and supply catches up. But with low unemployment levels and wage pressure starting to build, it's no longer appropriate for the Fed to be engaging in quantitative easing (QE) and keeping interest rates at 0%. For much of 2021, the Fed had been telling the market that inflation was likely to be quite transitory, but late last year fessed up that it was behind the eight ball and that inflation was likely to be more persistent. This has seen it stage a 180-degree turn that Fred Astaire would be proud of, changing its tune to a rapid exit from QE and bringing forward rate hikes from expected rises starting in 2024 to March 2022. A bomb is detonated under small-cap growth This about-face has seen a rapid lift in both short-term and long-term interest rates. You can see an example of this below with 2-year US government bond yields (red line) rising rapidly from November last year onwards as markets priced in Fed rate hikes. A veritable bomb was then set off under parts of the share market most vulnerable to higher interest rates, particularly long-term interest rates. Those parts most impacted are those where more of their cash flows are earned farther out into the future, such as more growth-orientated businesses. This occurs because when you value a business, higher long-term interest rates disproportionately reduce the present value of profits earned further out into the future. Small cap growth underperforms recently as markets price in higher interest rates
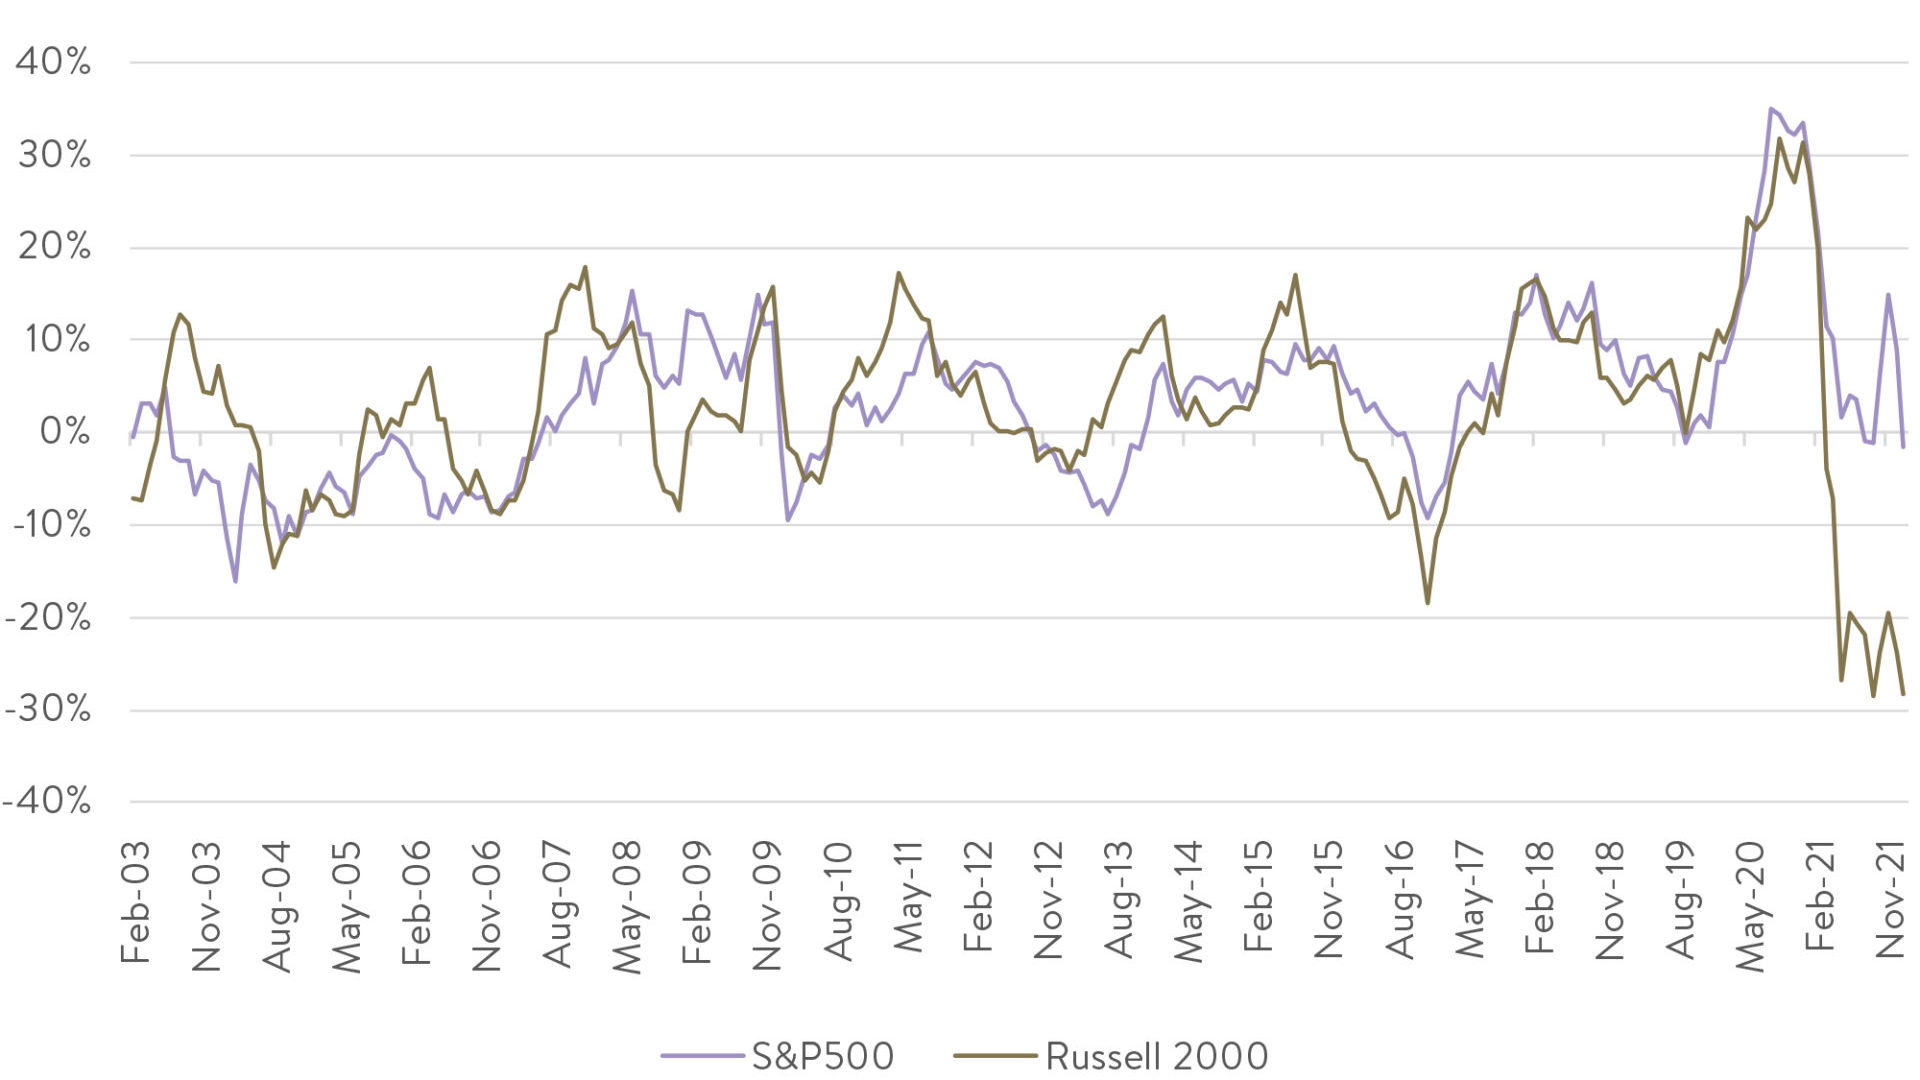
Source: Ophir, Factset Two of the most growth-orientated parts of the share market in the US, non-profitable technology business and recent IPOs have been savaged over the last three months - falling over 50%+ at the time of writing. At the other end of the spectrum, large caps via the S&P500 held up better, down only around -5% in January and only circa -7% since its 2021 highs. Looking at US small caps, as proxied by the Russell 2000 Index, they are down around -19% at writing from their 2021 highs. Whilst the Russell 2000 Growth Index, which looks at the faster-growing part of the small-cap market that we invest into, is down around -26%, well and truly into bear market territory. Interestingly the Russell 2000 Growth Index in January underperformed its Russell 2000 Value Index counterpart (of more mature, slower growing but cheaper businesses) by the second most in a month since the early 2000's tech wreck over 20 years ago. Perhaps even more eye-popping is the fact that over the last year that same growth index easily underperformed value by almost -30% - the most again in over 20 years! This is shown quite clearly in the gold line in the chart below. Normally this growth versus value under- or out-performance is mirrored in the large-cap part of the market (S&P500). But this period has been an extreme outlier. Quite simply this is because the growth-orientated stocks in the large-cap part of the market, such as the FAANG's, have seen their share prices hold up better to the end of January. Growth v value (yoy)
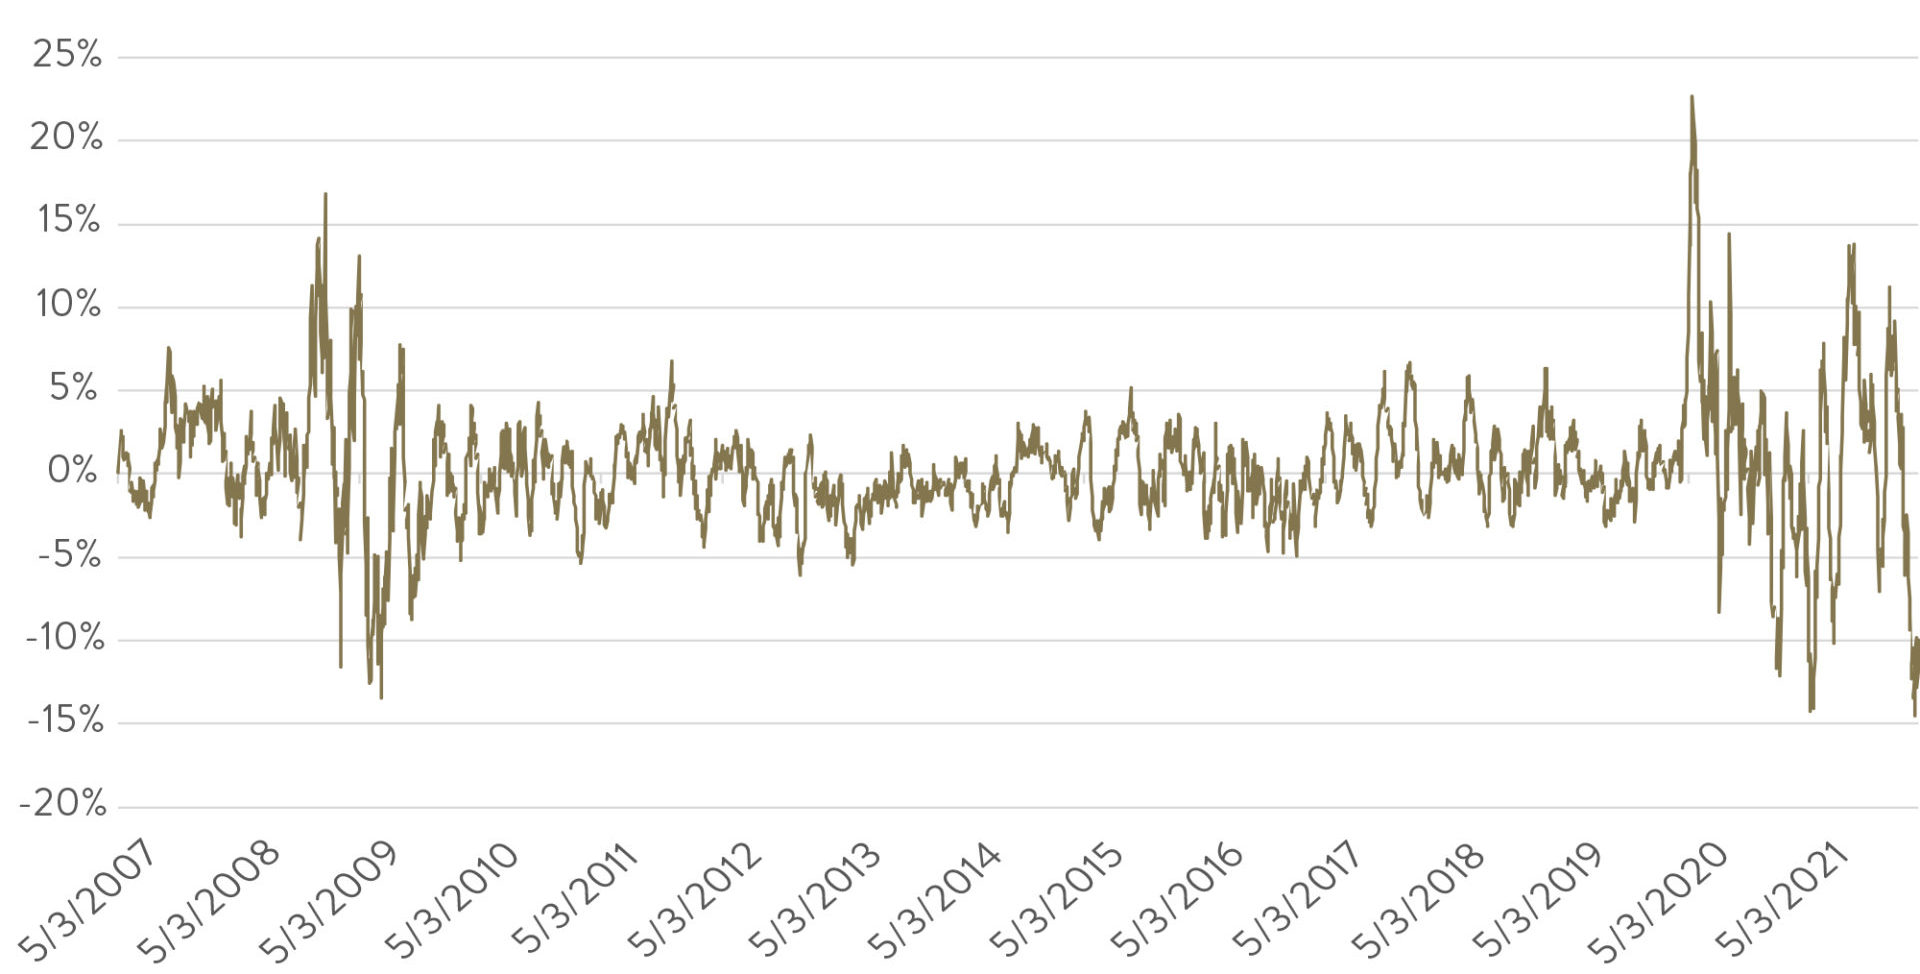
Source: Ophir, Factset This has also been reflected in the sector returns in US and also Australian small caps. The value-orientated sectors such as utilities, real estate, energy and materials (and also financials in the case of the US) have held up much better over the last three months. The sectors where you tend to find more growth-orientated businesses, such as IT, healthcare and consumer discretionary, have severely underperformed. Long-time investors will know that we tend to have larger allocations to businesses in our funds in those more growth-orientated sectors; and are underweight, or often have no allocation to the more value orientated sectors, particularly utilities and real estate. Why is this you may ask? Utilities and real estate companies tend to have inflation-linked cash flows that are relatively steady and contracted in nature, which makes the job harder for us to get an edge on the market pricing those cash flows. Moreover, they tend to have higher levels of debt, as do many 'value' type businesses which are more mature and whose more stable earnings make it easier to lend against. We generally avoid the most indebted companies because they can often get into trouble during an economic downturn. We prefer those with little debt or net cash on their balance sheet which provides optionality for future growth. When it's good to be bad (and why we will not compromise our strategy) One unique characteristic of the market sell-off in January has been that companies with higher levels of debt and weaker balance sheets have actually tended to outperform. And not by a little! As the below chart shows, companies with strong balance sheets have underperformed those with weak balance sheets in the US to a degree not seen since March/April 2009. Back then it was because the US was emerging from the GFC and if you were a highly geared business with lots of debt (if you were still around) you were now more comfortable you were going to survive - so their prices rallied. Today it's because the value sectors tend to have the most debt and investors are also more comfortable highly indebted businesses who were at risk are going to survive COVID-19. GS Strong V Weak Balance Sheet (mom)
Source: Ophir, Factset
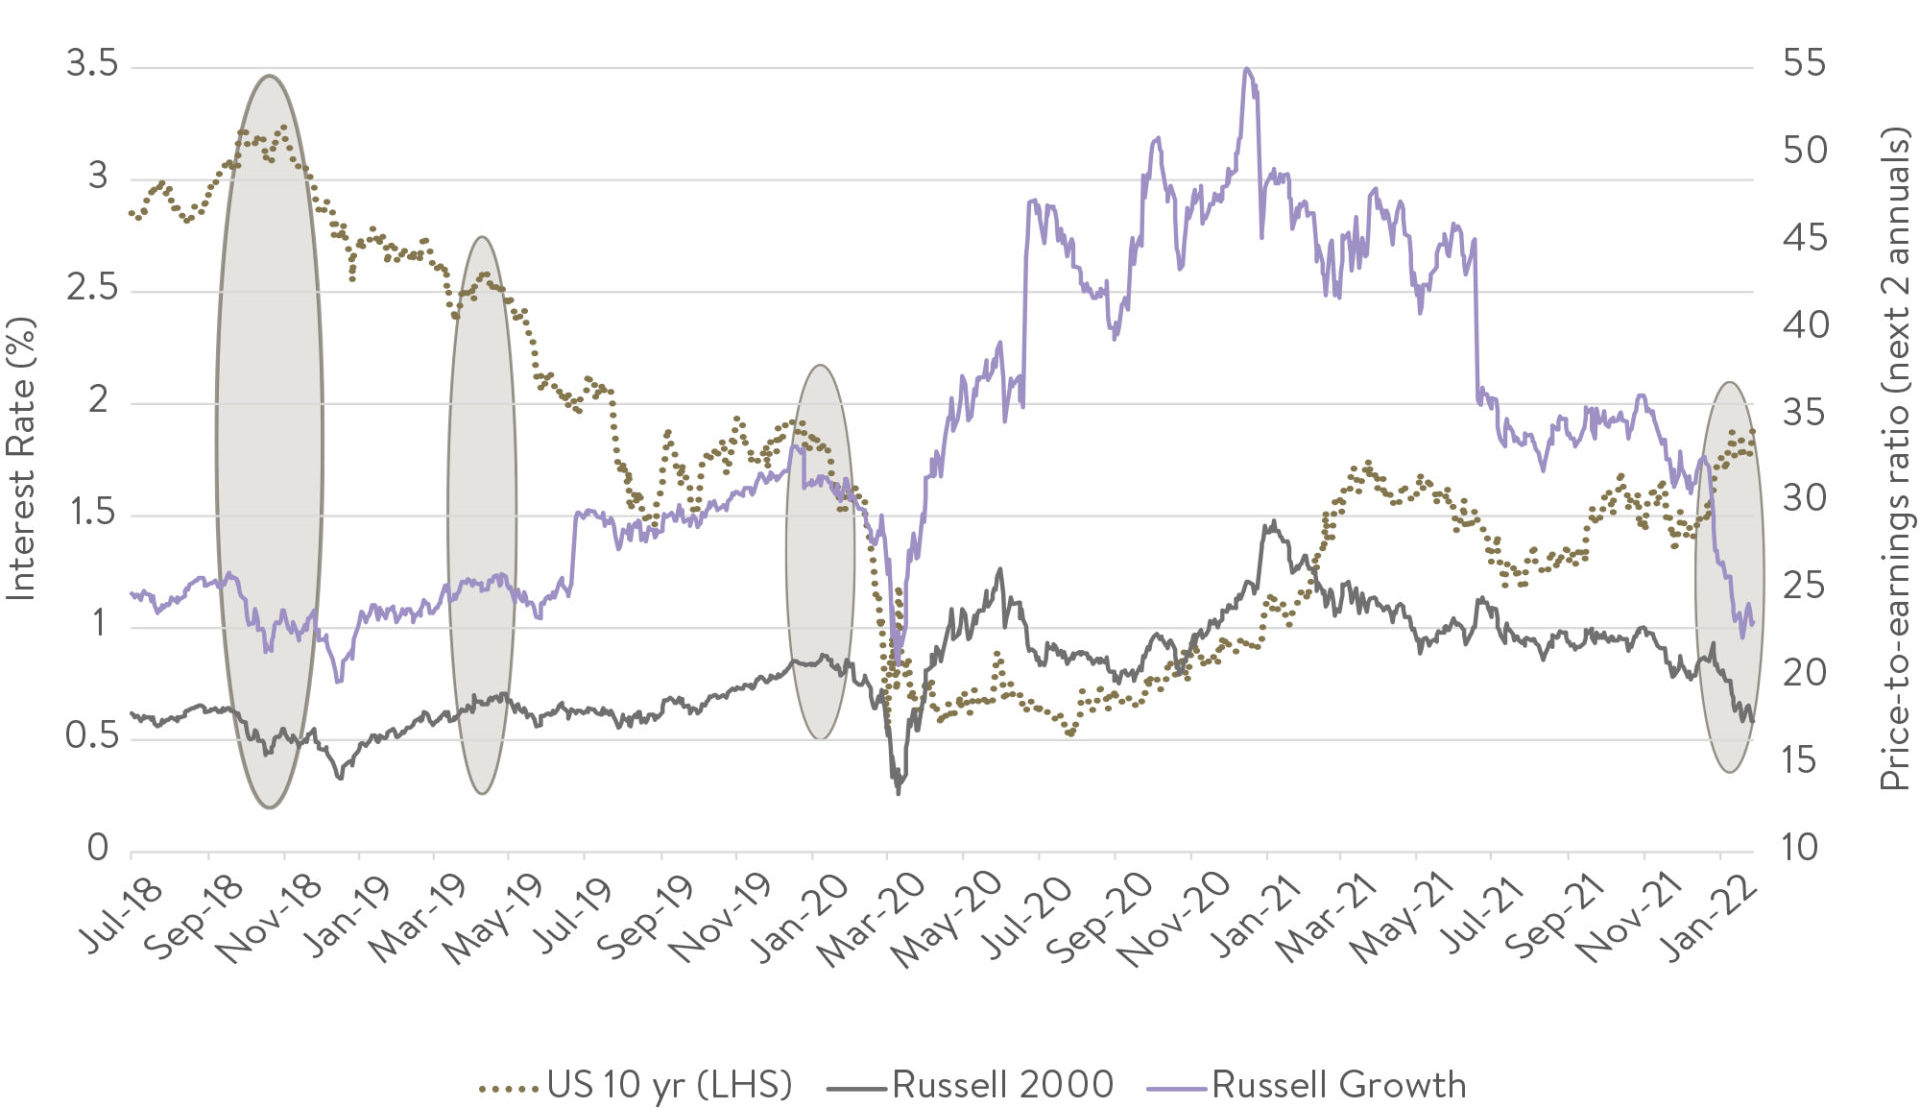
That is something we are not willing to do, and never will. Changing your spots as an investor to chase the flavour of the day has been the death knell for many funds management businesses and is a cardinal mistake. There is no doubt in hindsight that making such a radical change would have provided some short-term downside protection to our performance. However, in order to do so, aside from the impenetrable rule above of not changing our spots, we would have had to be able to correctly anticipate the change in the macroeconomic environment and the pivot from the Fed. That is one game we do not have an edge in. We are just as likely to be right there as we are to be wrong, with hundreds of thousands of professional investors parsing the daily macroeconomic tea leaves. We'd rather keep our performance reliant on the very detailed bottom-up work we do to understand the growth of small caps and how the market is pricing it - and where there is a comparative dearth of people looking. So, where to from here ... The $64 billion dollar question. One thing is certain: ultimately the market will be willing to pay up for companies that can display earnings growth. What we have seen that gives us some comfort that perhaps most of the de-rating of small growth-orientated companies may have occurred already, particularly in the US, is current valuations. In the chart below we show both the US 10-year government bond yield (the so-called global risk-free rate that is key to valuing businesses) and also the price-to-earnings ratios for the US Small Cap (Russell 2000) and US Small Cap Growth (Russell 2000 Growth) parts of the market. Valuation compression: rising interest rates
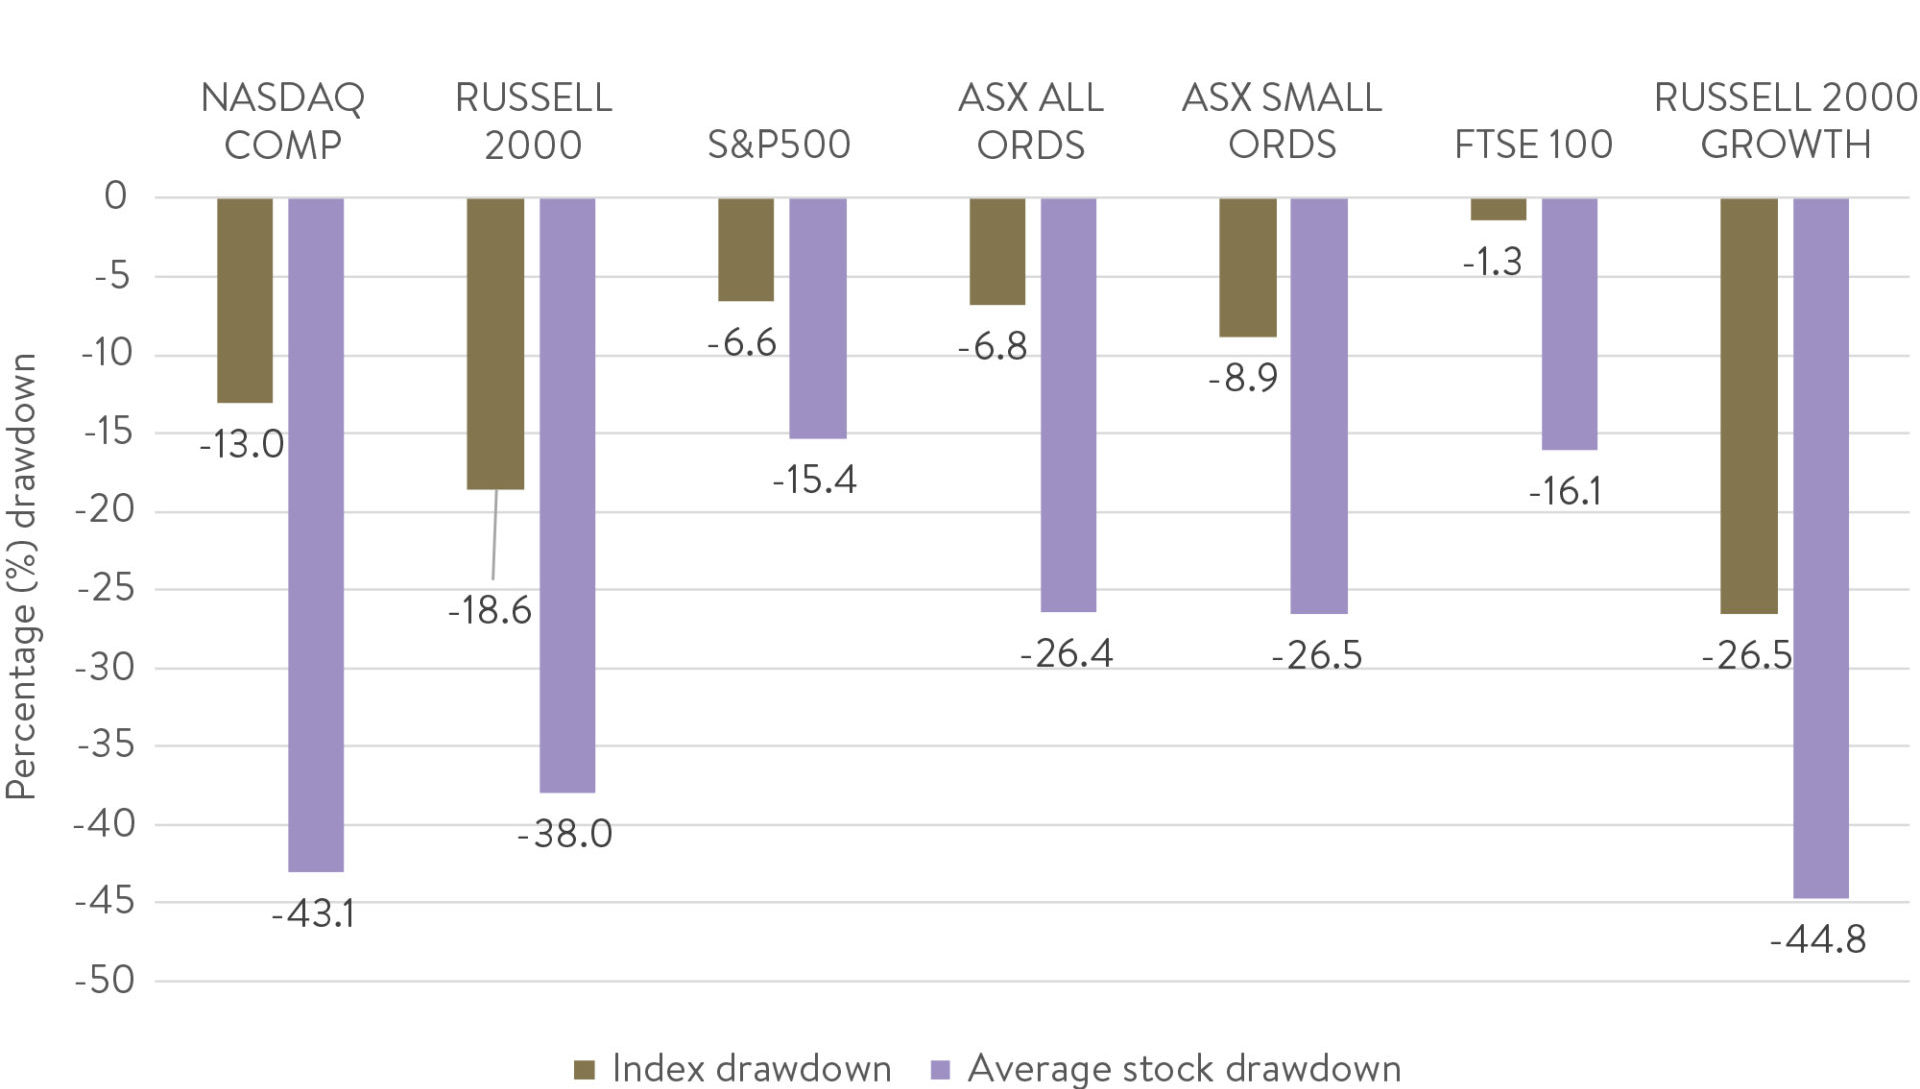
Source: Ophir, Factset What we can see is that the US bond yield is now back at the same levels (1.8-2%) as early 2020 just prior to COVID-19. But valuations (P/Es) for the Russell 2000 and Russell 2000 Growth parts of the share market are back down to levels seen in 2018 when the key US 10-year interest rate was much higher (3-3.5%). What this says to us is that falls in these parts of the share market are already factoring in much higher interest rates - and at the high end of what most strategists are forecasting over the next few years. Another measure that highlights the value that is emerging in US small caps is looking beyond the headline indices to how much the average stock has actually fallen. The below chart shows how much various headlines indices have fallen from their highs over the last year and compares it to how much the average constituent of that index has fallen. The average Russell 2000 and Russell 2000 Growth Index constituent is down a truly mammoth -38% and -45% respectively - far in excess of the headline index. How? Well, its partly because indices are market-cap weighted, so the biggest companies have a disproportionate influence on the index outcome and have fallen less. But for benchmark unaware active managers such as us, it is actually the average stock fall that is more indicative of the market we invest into. The bear is on the loose
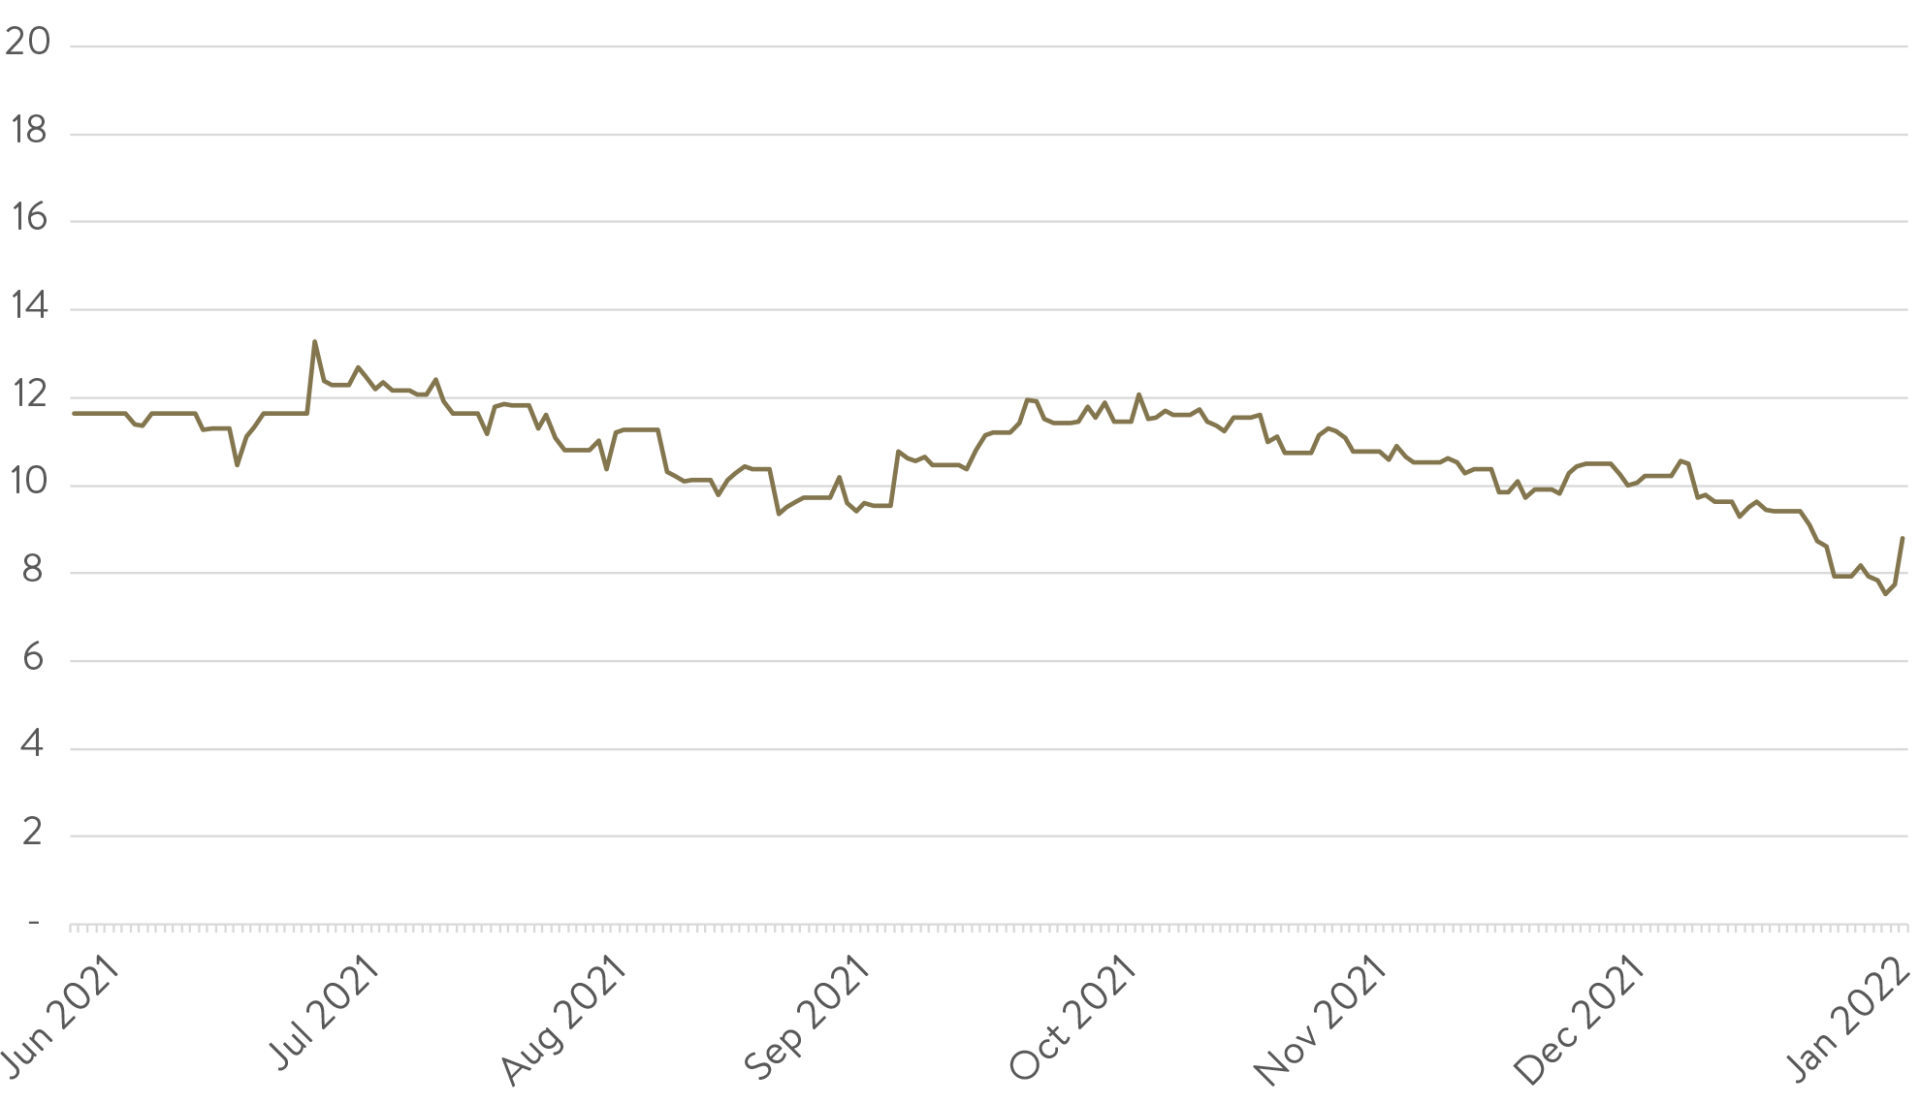
Source: Ophir, Factset Finally in terms of value, by way of example, below we show our preferred valuation metric for our Global Opportunities Fund: Enterprise Value of a company (Equity + Debt value) divided by its cash-flow-generative ability, as proxied by Earning Before Interest, Tax, Depreciation and Amortisation (EBITDA). As you can see, the price paid for EBITDA across the companies in the Global Opportunities Fund (demonstrated by their median) has decreased significantly over the last few months. All the while the fund's sustainable earnings growth capacity has remained consistent in the 20-30% range. GOF EV/EBITDA (12m forward)
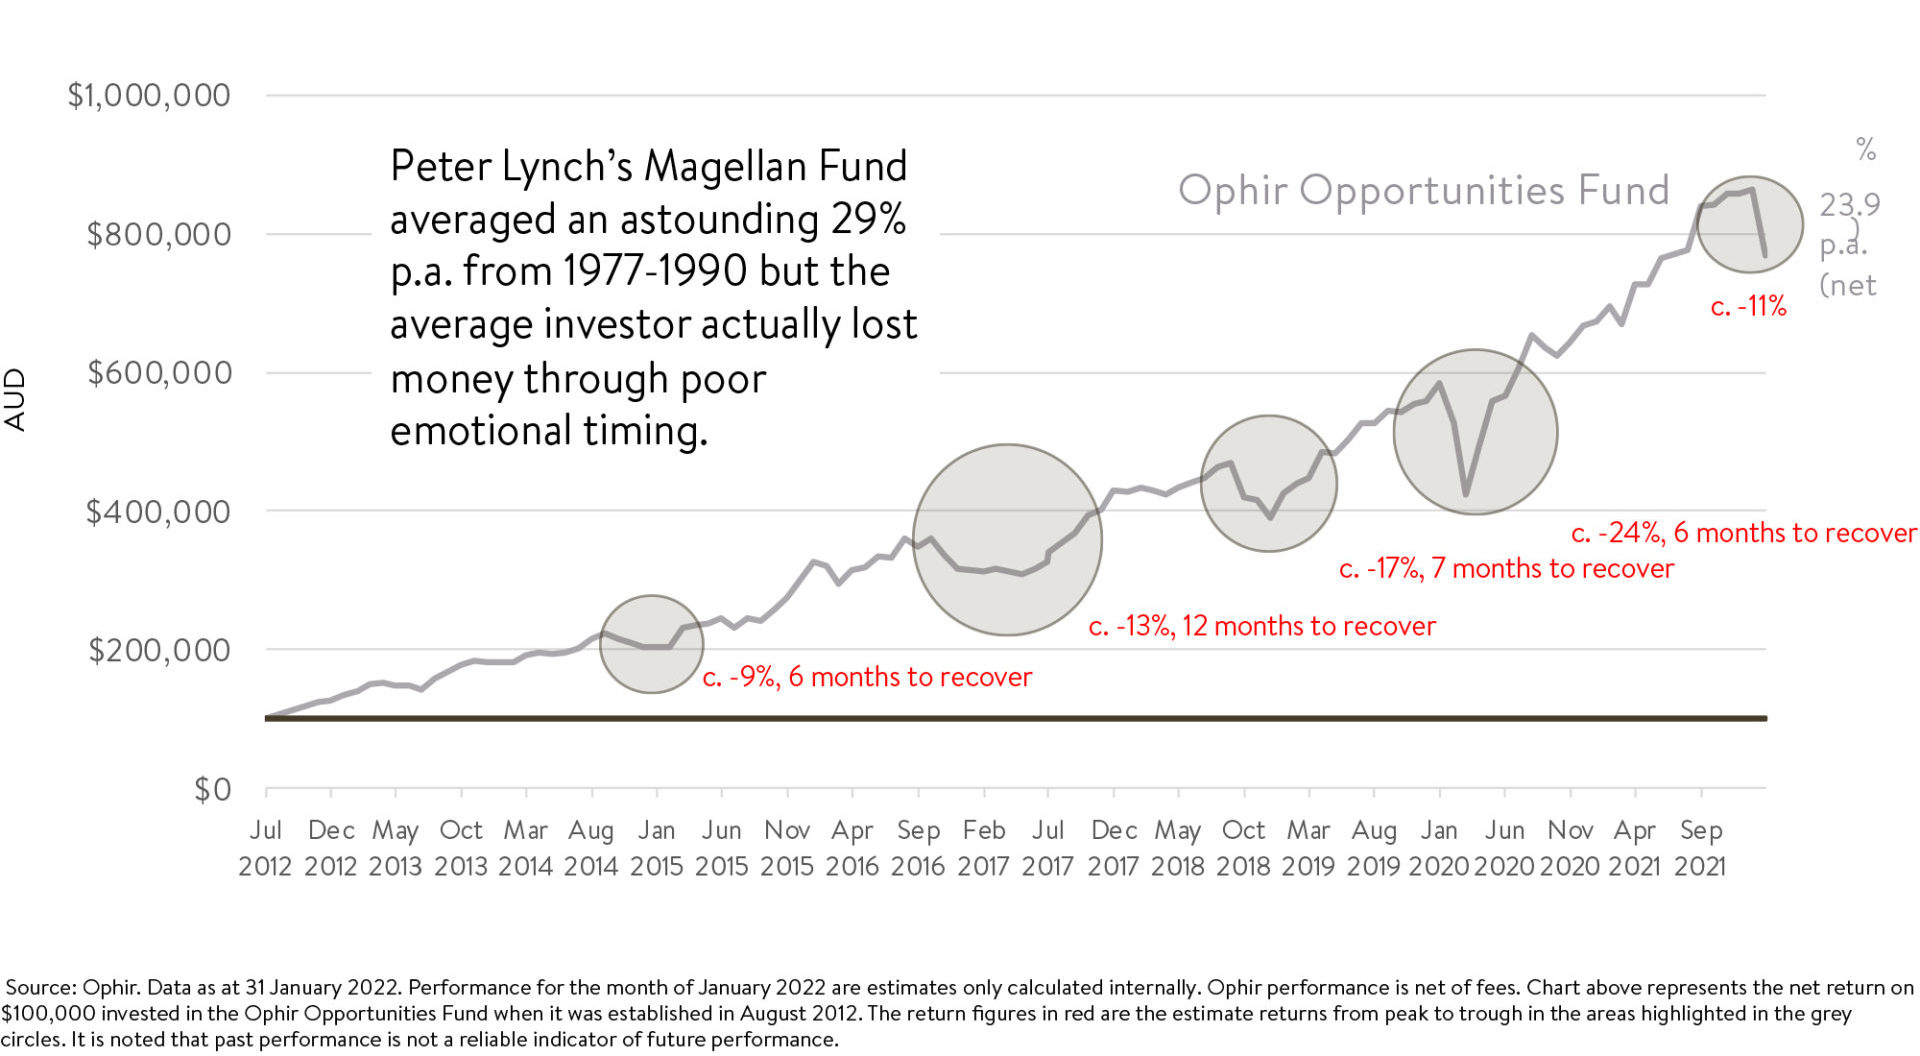
Source: Ophir, Factset The bottom line here is that, in all its history, we have not seen the earnings growth in this fund as cheap to buy as today. Could it get cheaper? Yes absolutely. But on a medium-term to long term basis we see great value on offer so remain being close to fully invested (only 1-2% cash) in this fund. And finally, we've heard this record before No one likes to go through periods of negative performance or underperformance compared to the market - least of all us! We have and will continue to have all our investable wealth in the Ophir Funds. But we also know that this time is not unique. We have had pullbacks in performance before. Below we show the almost 10-year performance history of our Ophir Opportunities Fund - our original Australian small-cap fund that has generated an asset-class-leading 23.9%pa (net). There have been five periods of material pullbacks now, one about every two years, so they've hardly been infrequent. Late 2016 probably is the closest analogy to now. You may remember this was the time when Trump was elected with a reflationary agenda and we saw synchronised global growth and higher interest rates. The commonality of these five periods shown below is they saw circa 10-25% falls in performance and 6-12 months to recover to their previous peaks.
For those that have seen enough cycles as we have, these periods have generally been opportune times to add to investments at reduced prices. A cautionary tale is in the anecdote above from famed investor Peter Lynch's Magellan Fund. Magellan was the best returning share fund from 1977 to 1990. But the average investor in the fund actually lost money! How? They tended to put money into the fund after short-term outperformance and took money out when it had performed poorly - the total opposite of the proven strategy of buying low and selling high. In fact, you could say that transitory negative performance and underperformance to peers in the short term is a feature, not a bug, of generating superior long-term performance. Written By Andrew Mitchell & Steven Ng, Co-Founders & Senior Portfolio Managers |
|
Funds operated by this manager: |
|
This document is issued by Ophir Asset Management Pty Ltd (ABN 88 156 146 717, AFSL 420 082) (Ophir) in relation to the Ophir Opportunities Fund, the Ophir High Conviction Fund and the Ophir Global Opportunities Fund (the Funds). Ophir is the trustee and investment manager for the Ophir Opportunities Fund. The Trust Company (RE Services) Limited ABN 45 003 278 831 AFSL 235150 (Perpetual) is the responsible entity of, and Ophir is the investment manager for, the Ophir Global Opportunities Fund and the Ophir High Conviction Fund. Ophir is authorised to provide financial services to wholesale clients only (as defined under s761G or s761GA of the Corporations Act 2001 (Cth)). This information is intended only for wholesale clients and must not be forwarded or otherwise made available to anyone who is not a wholesale client. Only investors who are wholesale clients may invest in the Ophir Opportunities Fund. The information provided in this document is general information only and does not constitute investment or other advice. The information is not intended to provide financial product advice to any person. No aspect of this information takes into account the objectives, financial situation or needs of any person. Before making an investment decision, you should read the offer document and (if appropriate) seek professional advice to determine whether the investment is suitable for you. The content of this document does not constitute an offer or solicitation to subscribe for units in the Funds. Ophir makes no representations or warranties, express or implied, as to the accuracy or completeness of the information it provides, or that it should be relied upon and to the maximum extent permitted by law, neither Ophir nor its directors, employees or agents accept any liability for any inaccurate, incomplete or omitted information of any kind or any losses caused by using this information. This information is current as at the date specified and is subject to change. An investment may achieve a lower than expected return and investors risk losing some or all of their principal investment. Ophir does not guarantee repayment of capital or any particular rate of return from the Funds. Past performance is no indication of future performance. Any investment decision in connection with the Funds should only be made based on the information contained in the relevant Information Memorandum or Product Disclosure Statement. |


